Oracle · Case study
New Introductions
A new feature for forecasting demand on products, distribution centers, or customers that don't exist yet.
The problem
New products, locations, and customers have no sales history.
A demand plan forecasts based on historical data. A brand new product, a new distribution center, or a new customer doesn't have any — there's nothing for the system to calculate from. Before this feature, a demand planner had no structured way to set up that forecast; it took manual work outside the system.
The goal
Map demand from what's being replaced onto what's replacing it.
As a demand planner, I need to map demand from existing products, locations, or customers onto the new ones being introduced, so the new ones start with a forecast instead of a blank history.
- 01 One new item can replace one old item (a direct replacement).
- 02 One old item can be replaced by several new items, splitting its demand between them.
- 03 Several old items can be replaced by one new item, combining their demand.
- 04 Several old items can be replaced by several new items, in any combination.
- 05 This applies beyond products — the same feature has to work for distribution centers and customers.
The solution
A guided process with five steps.
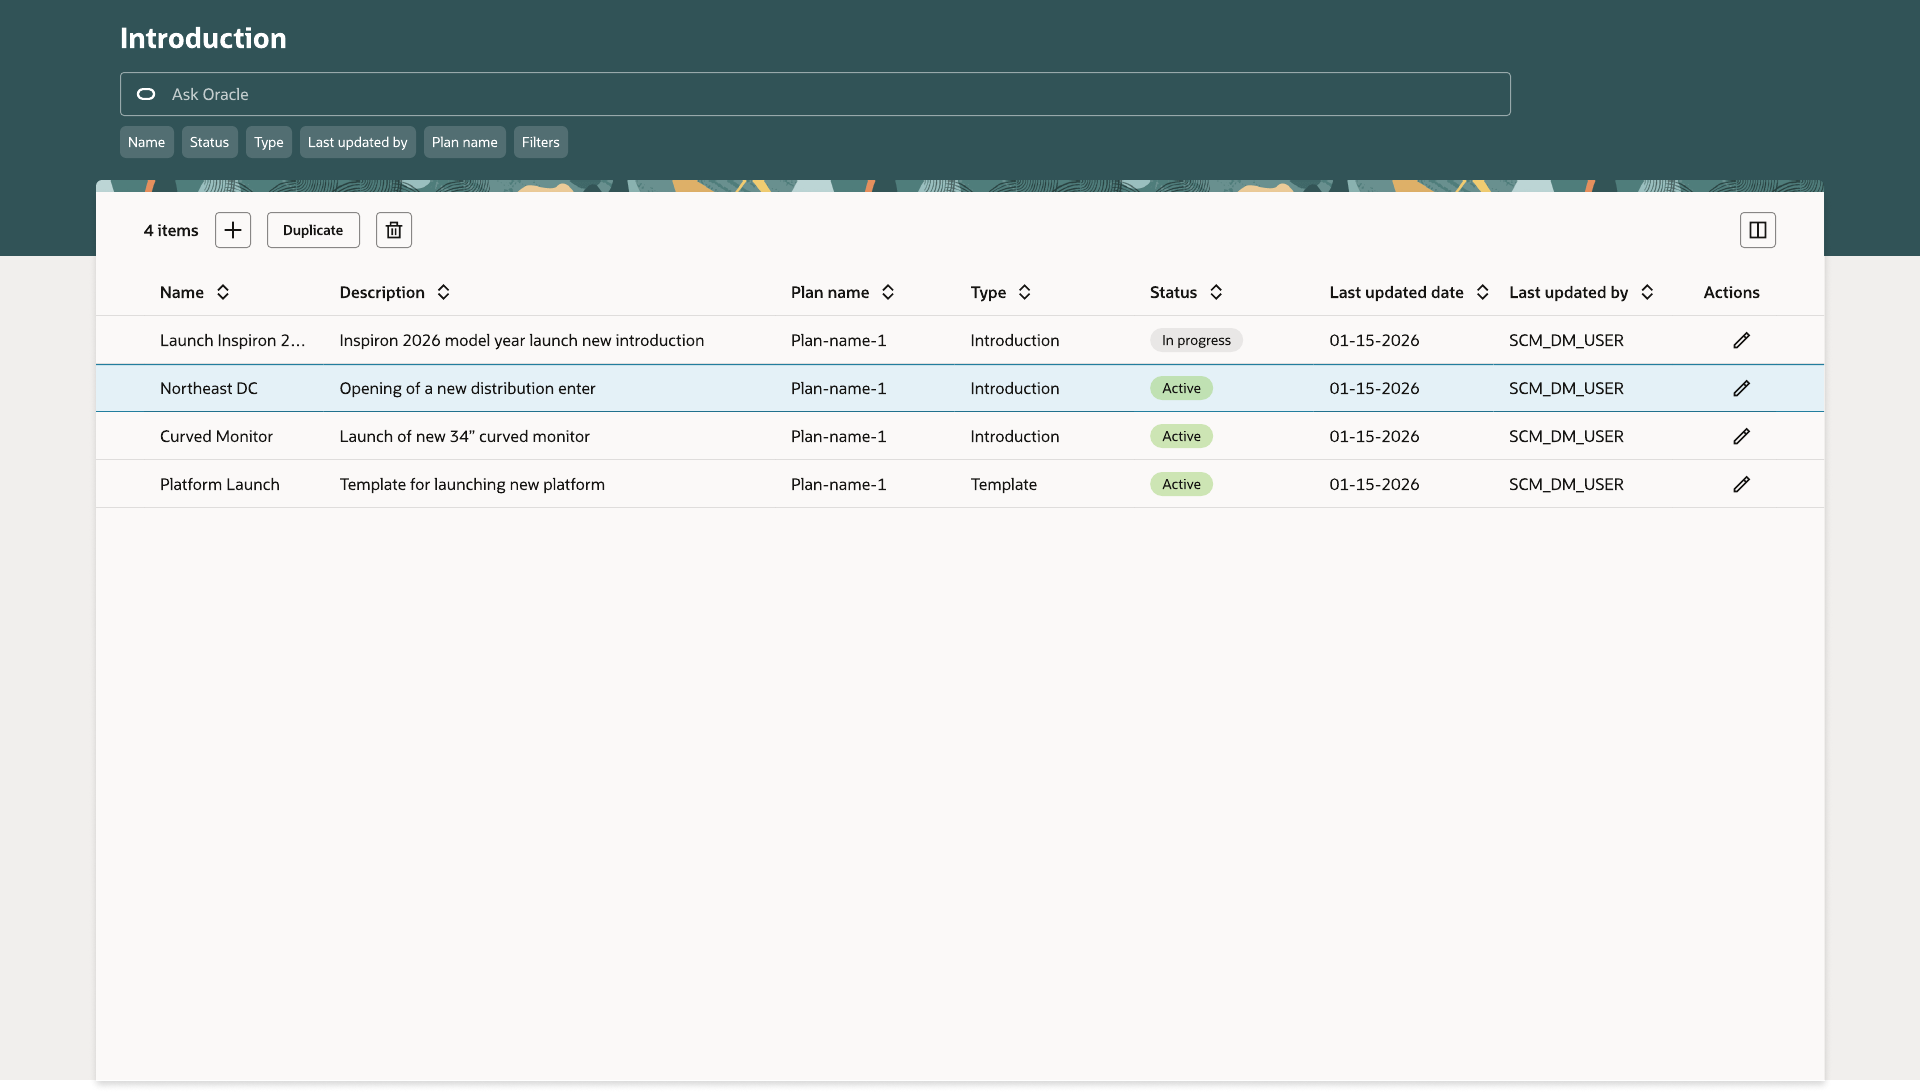
A demand planner sets up an introduction — or a reusable template for repeated ones — and works through General, Scope, Measures, and Mapping, ending with a Summary before it's submitted.
Step 1
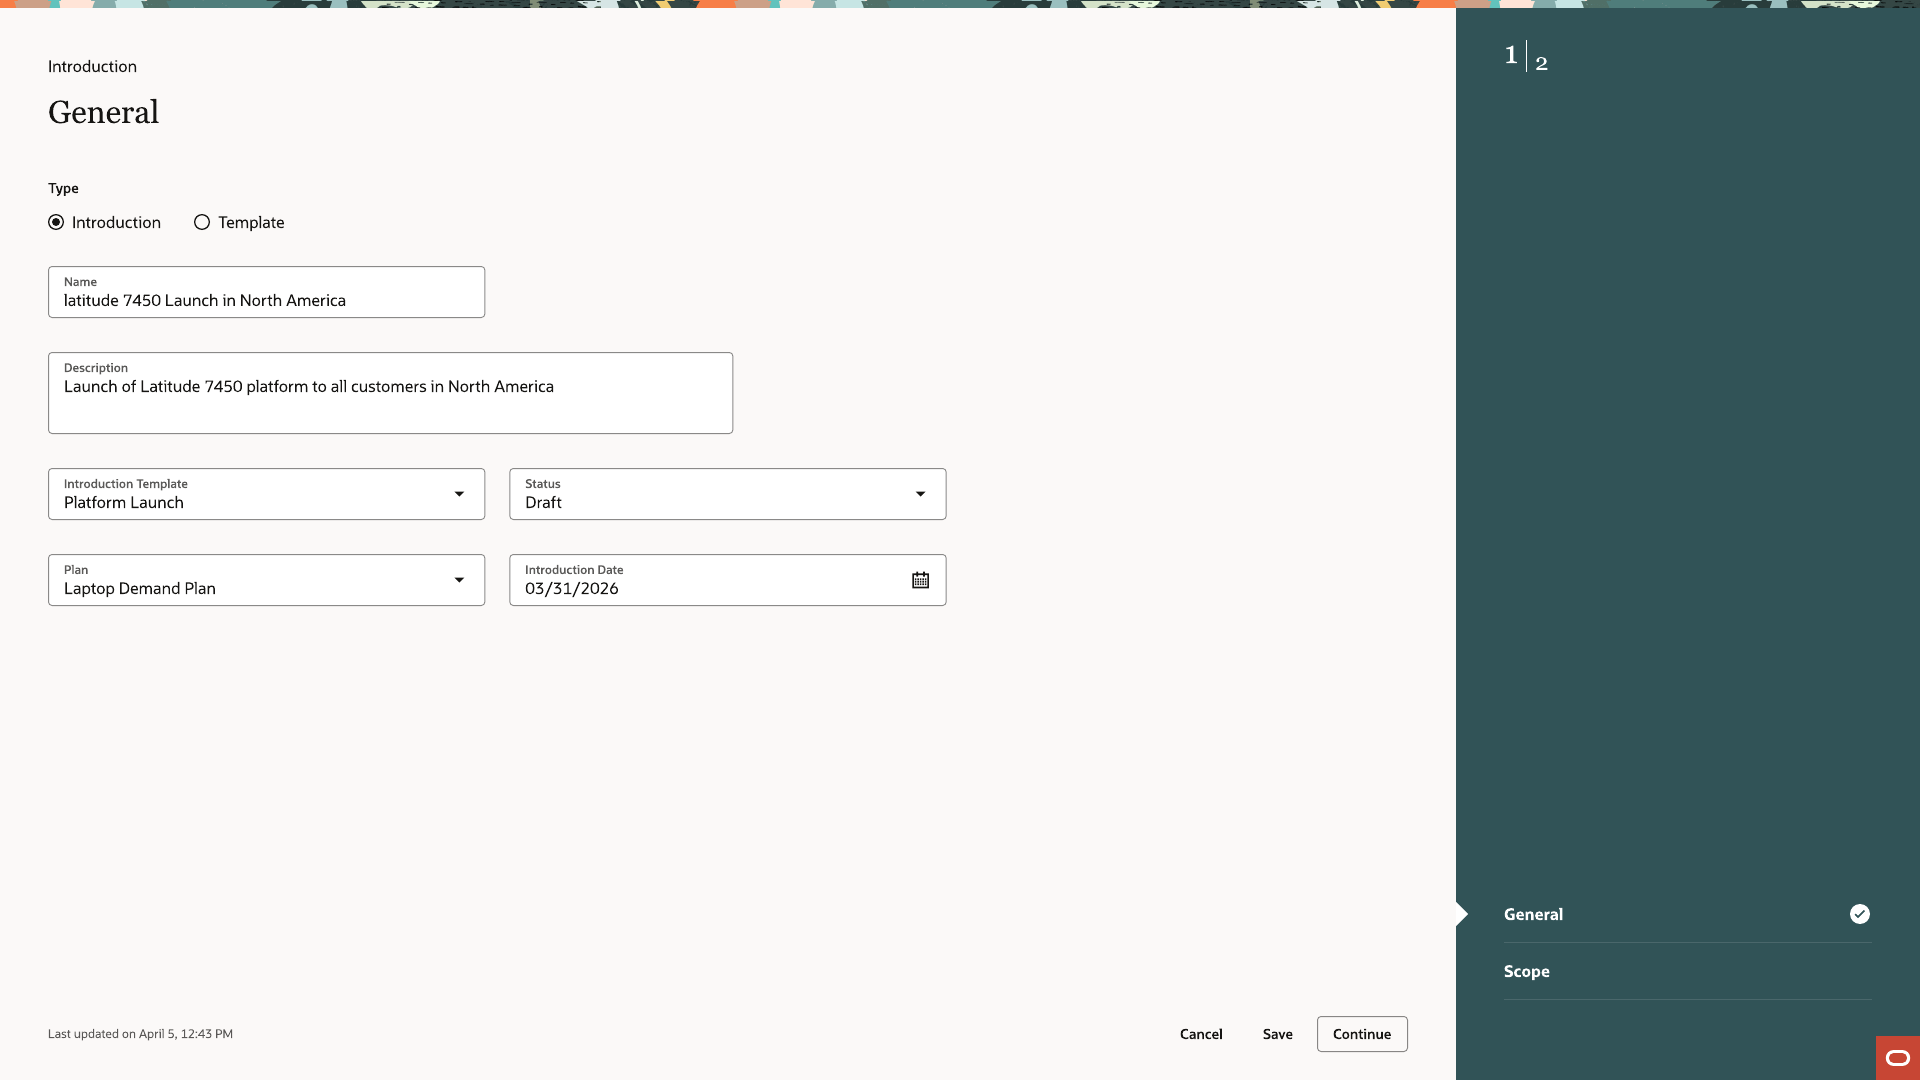
General
Name, description, which plan it belongs to, and the date it takes effect.
Step 2
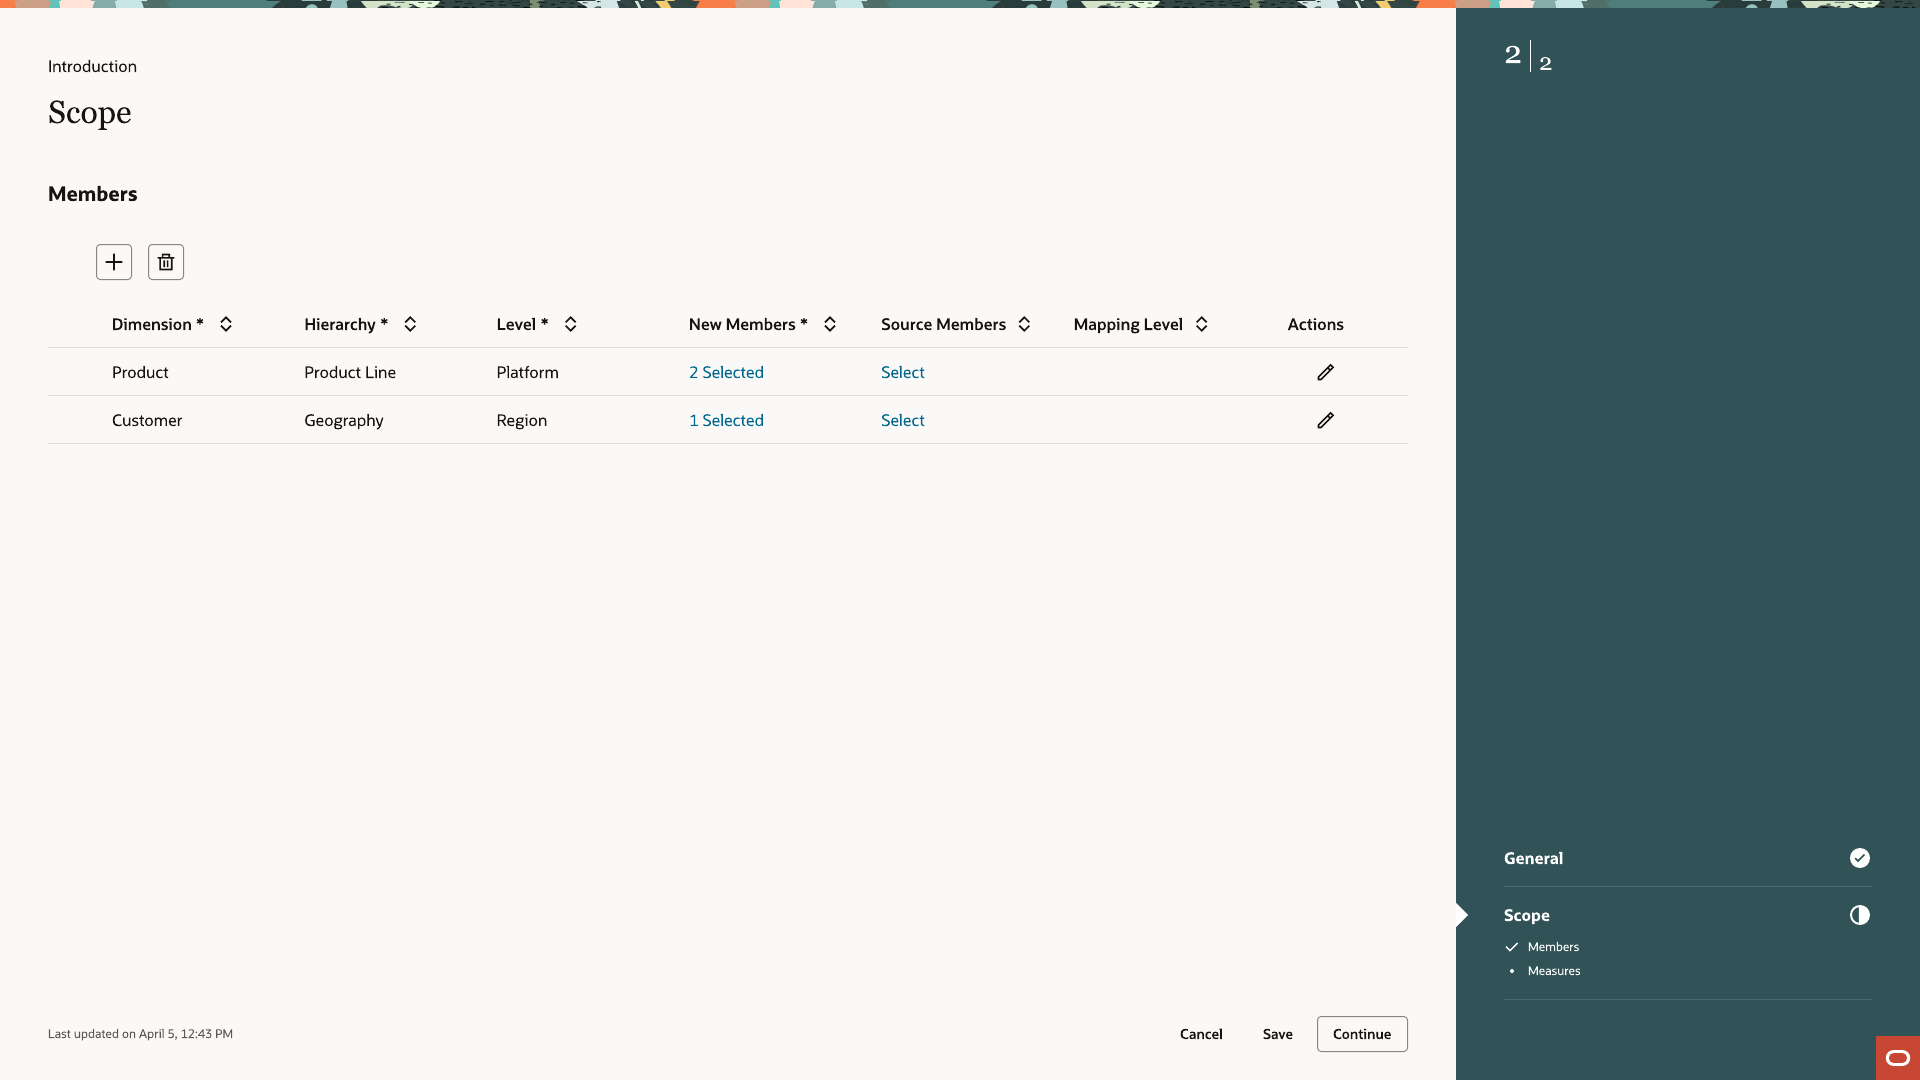
Scope
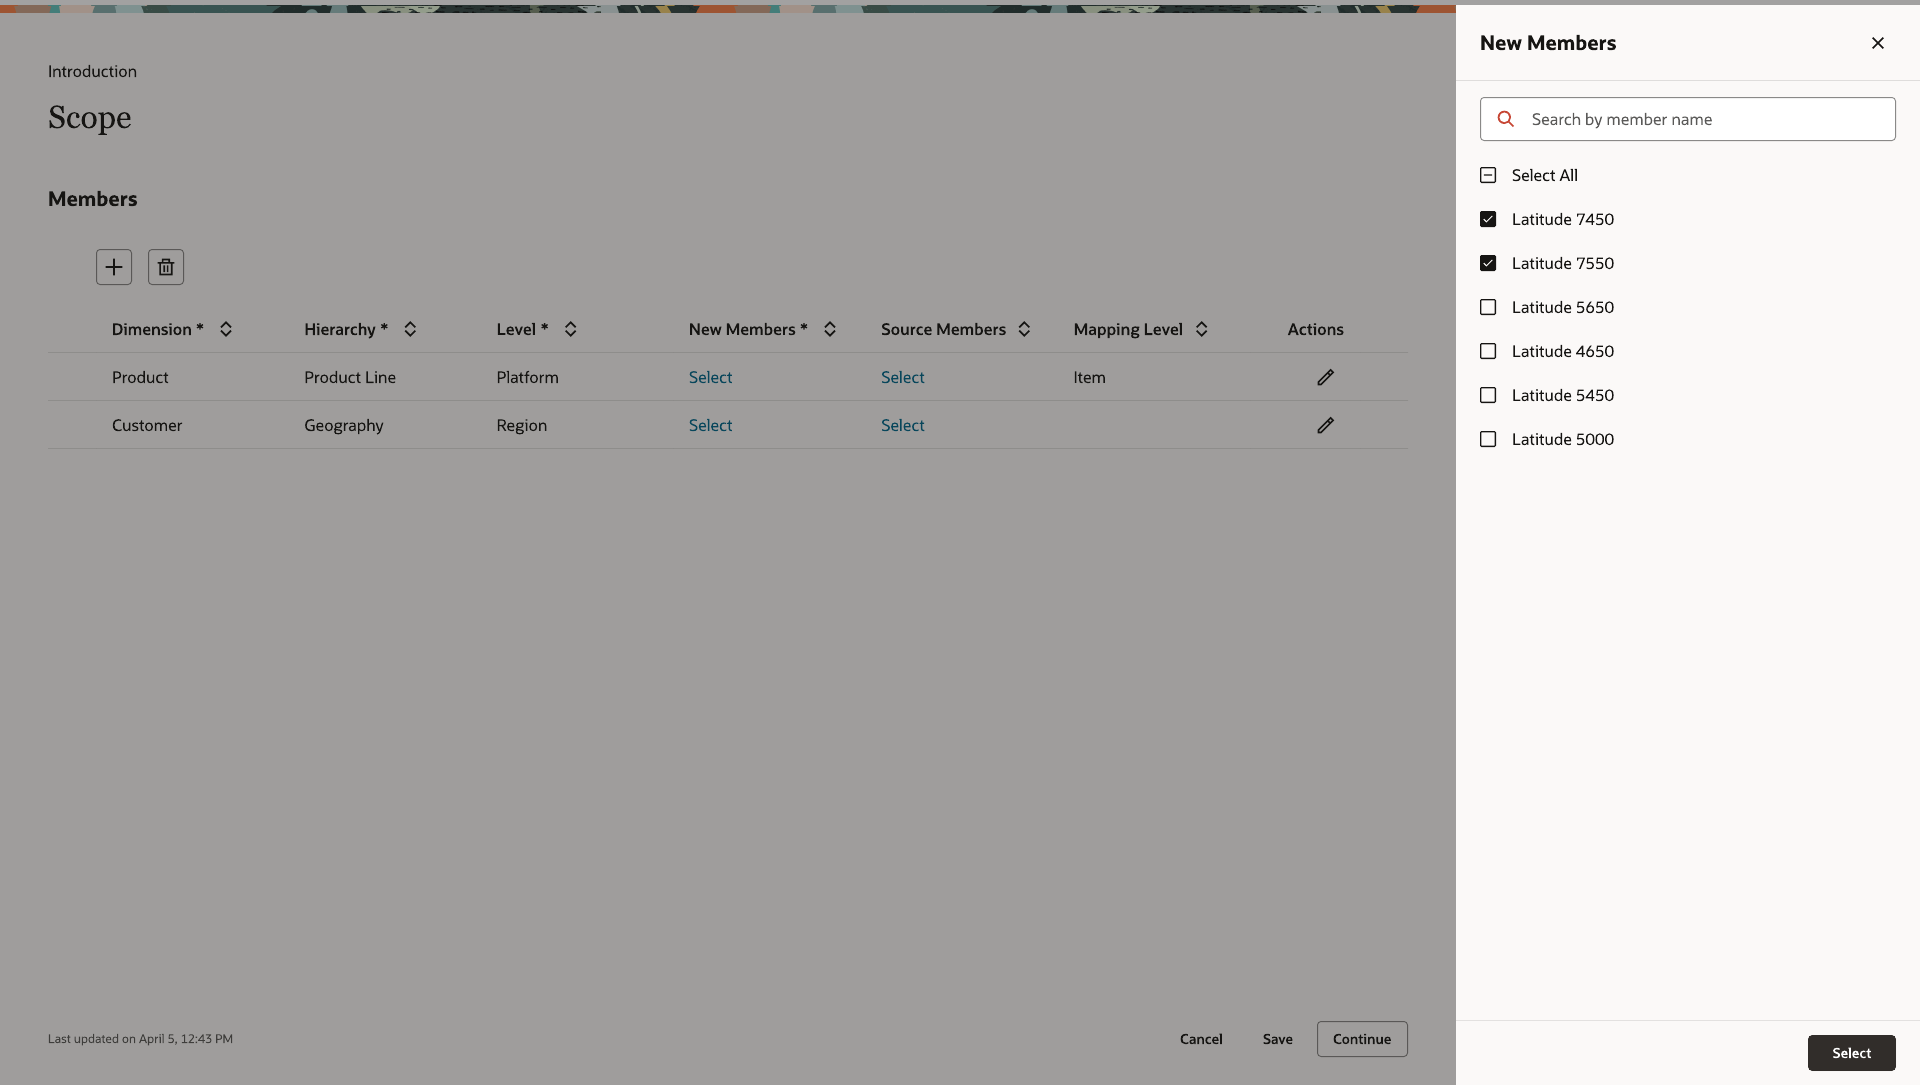
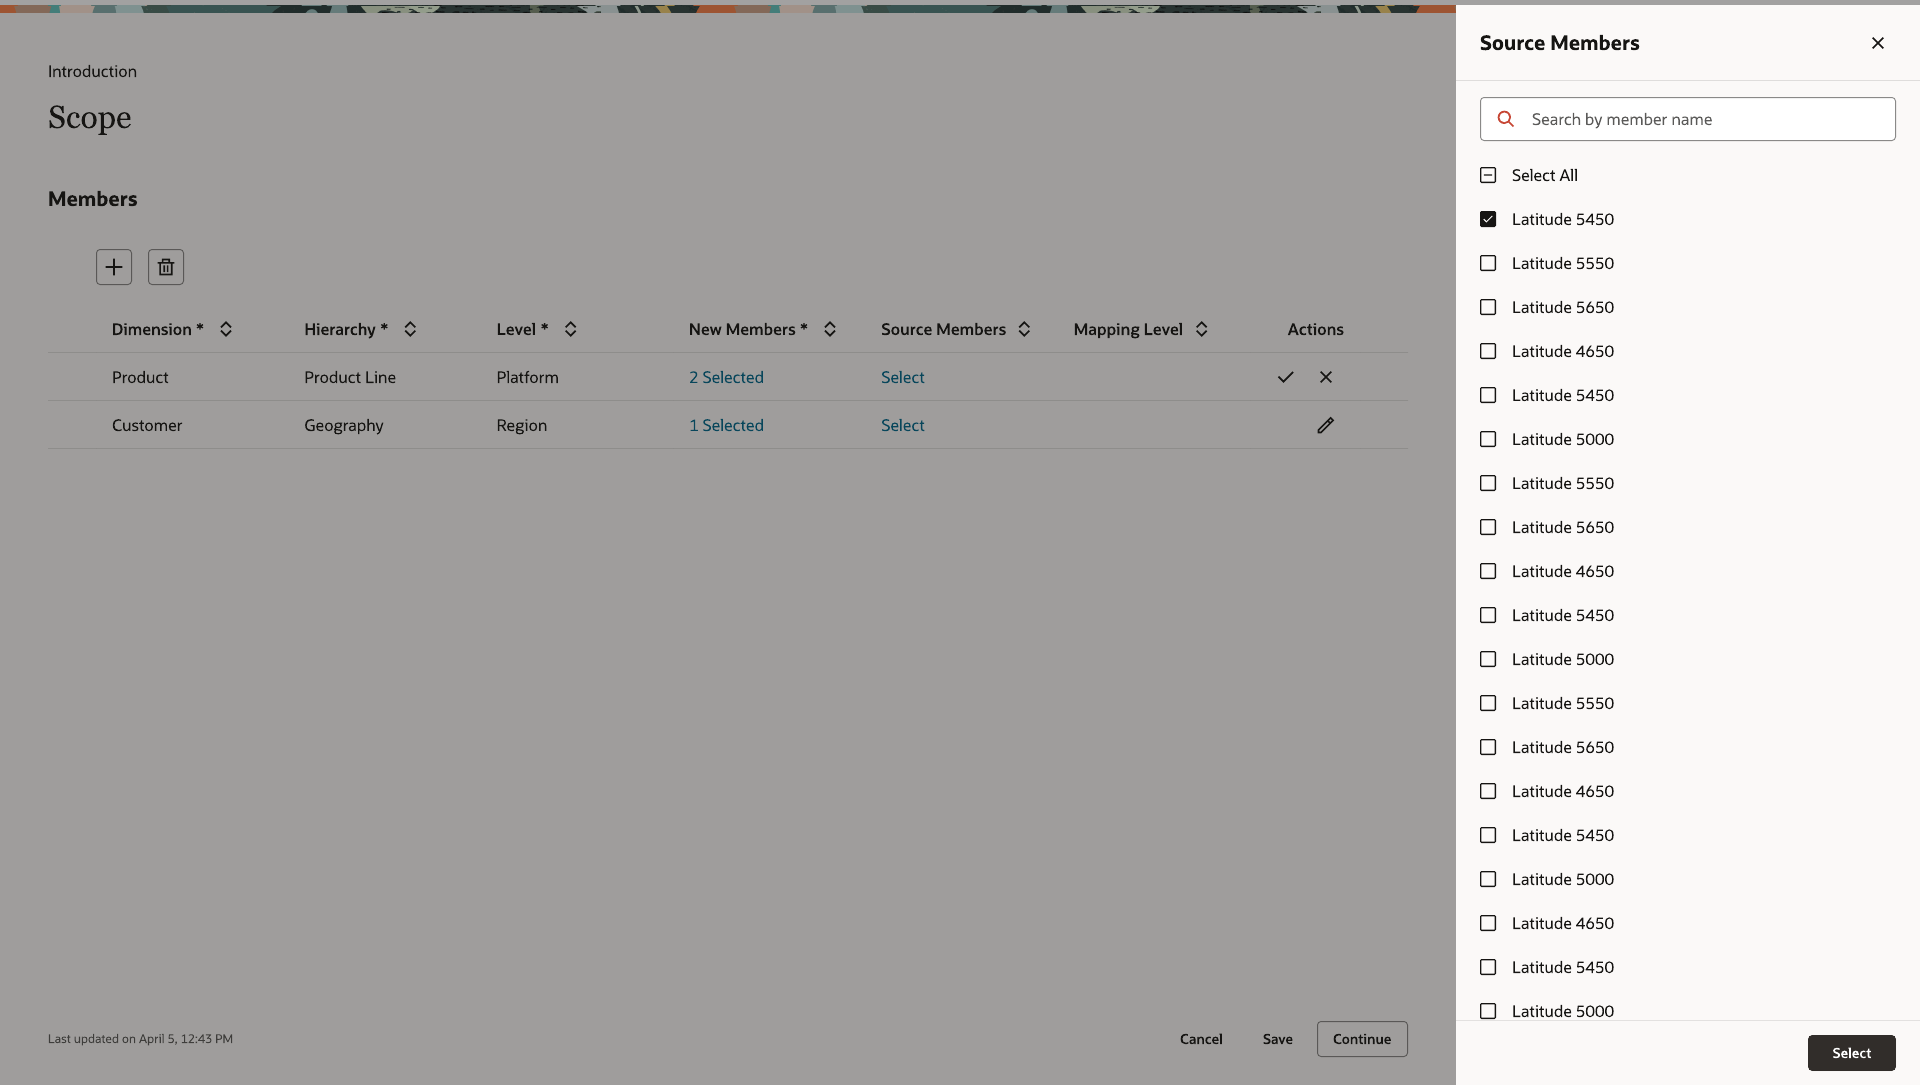
Which new items are being introduced, and which existing items they're replacing. This can apply to products, distribution centers, or customers.
Step 3
Measures
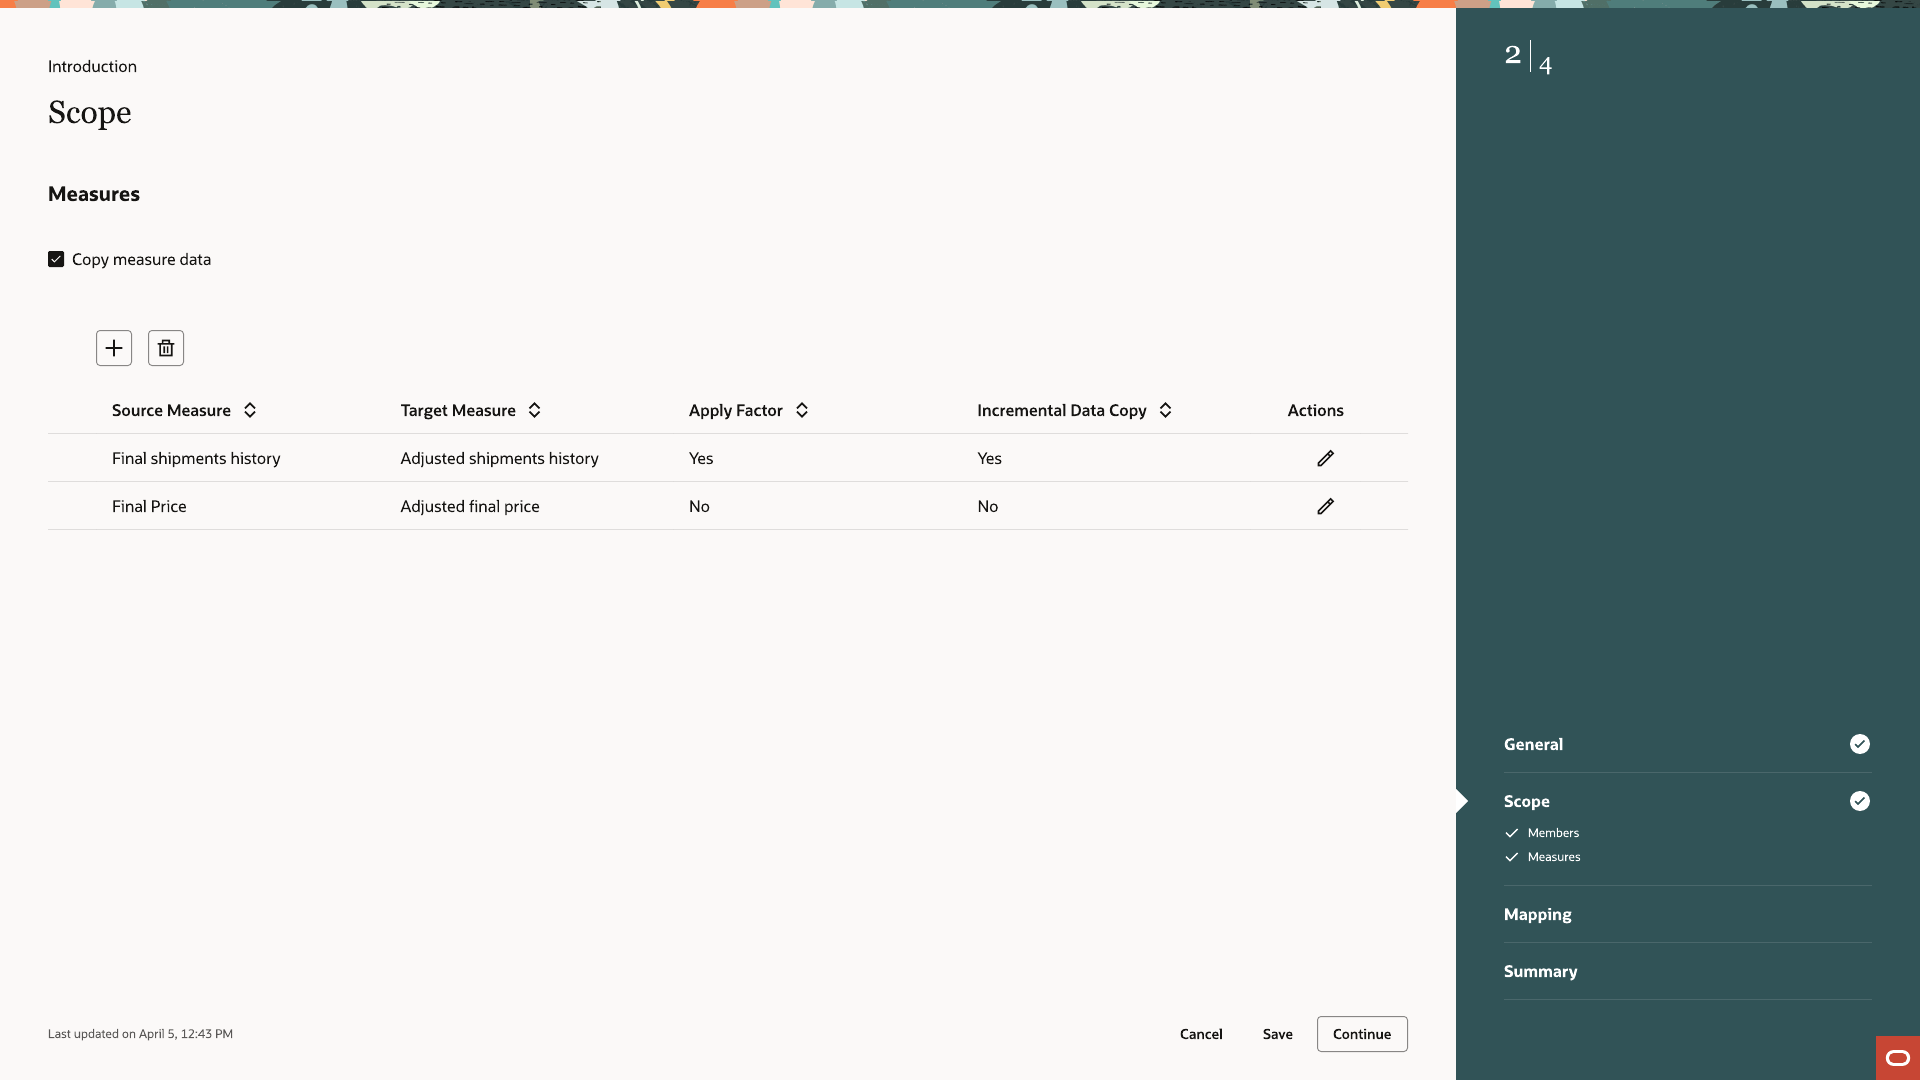
Which data actually copies from the old item to the new one — shipment history, price, or anything else the plan tracks — and whether it updates every time the plan runs or only once.
Step 4
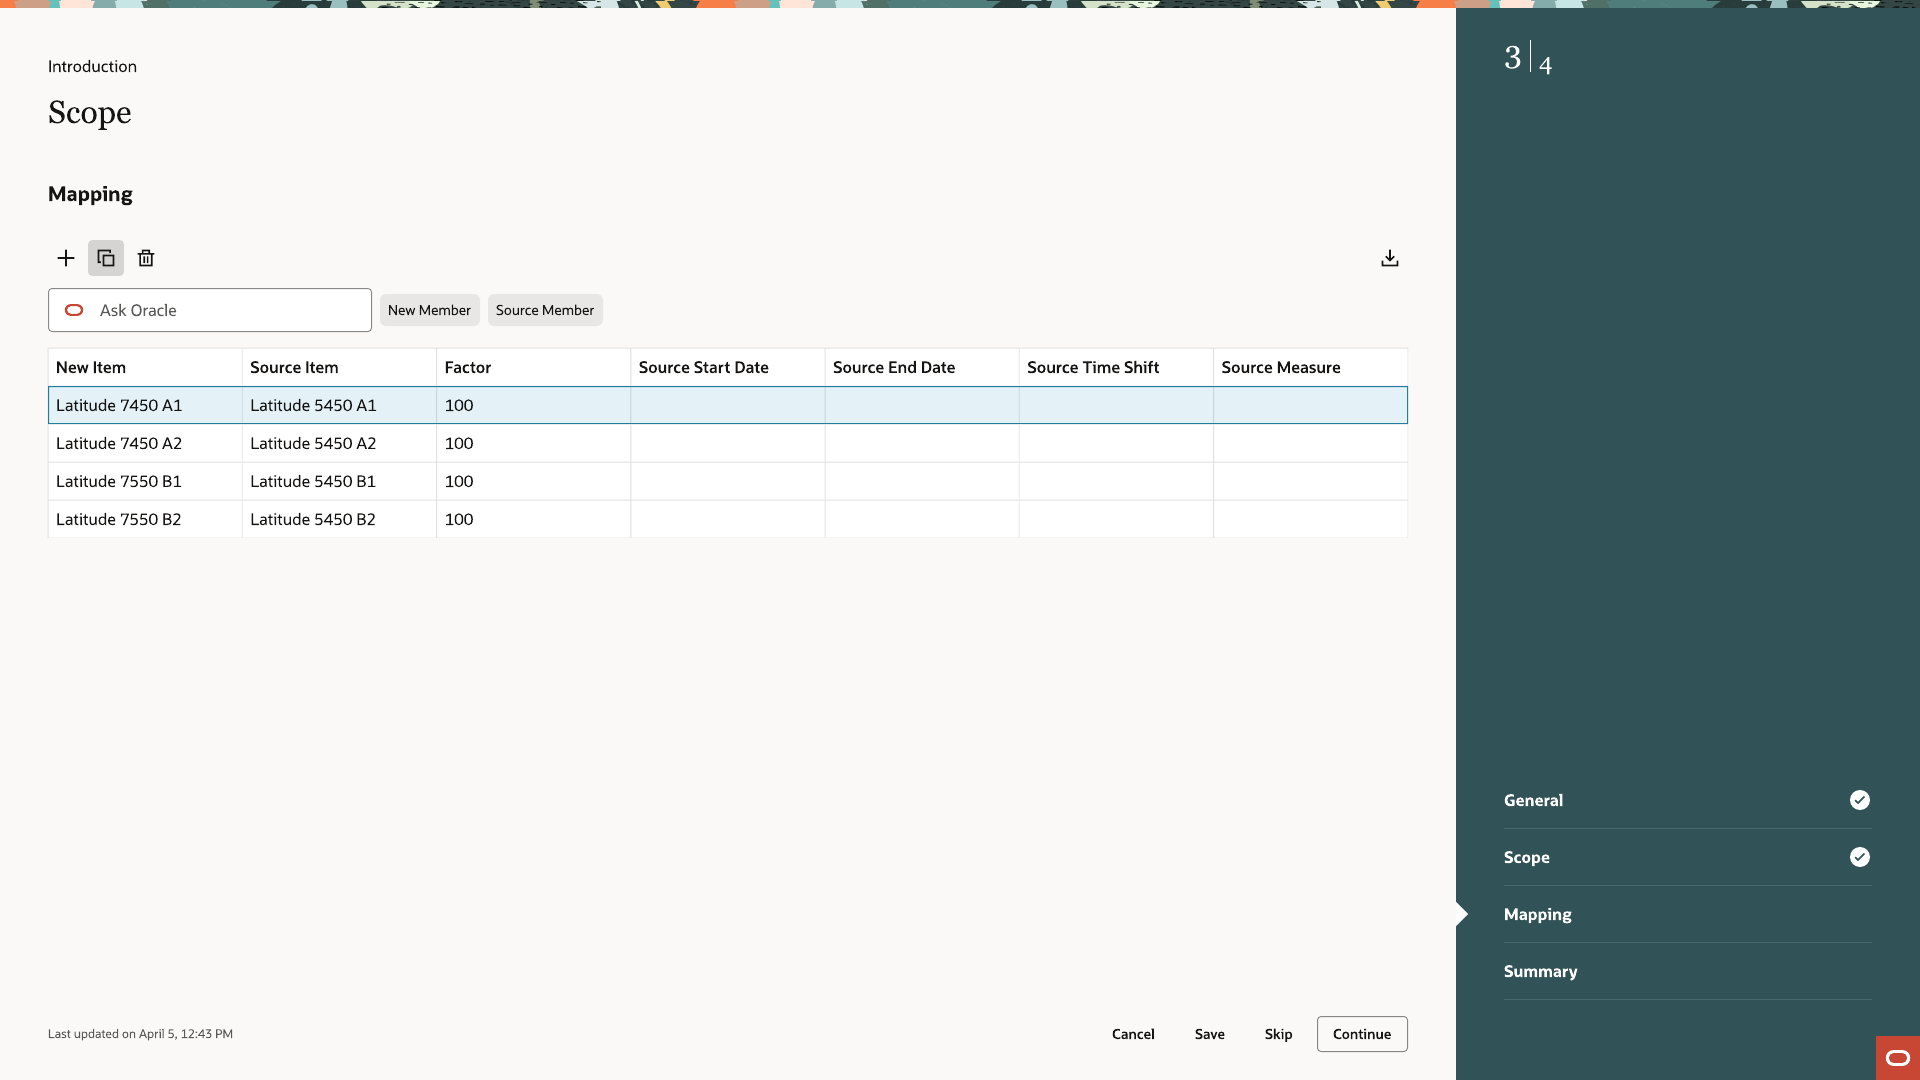
Mapping
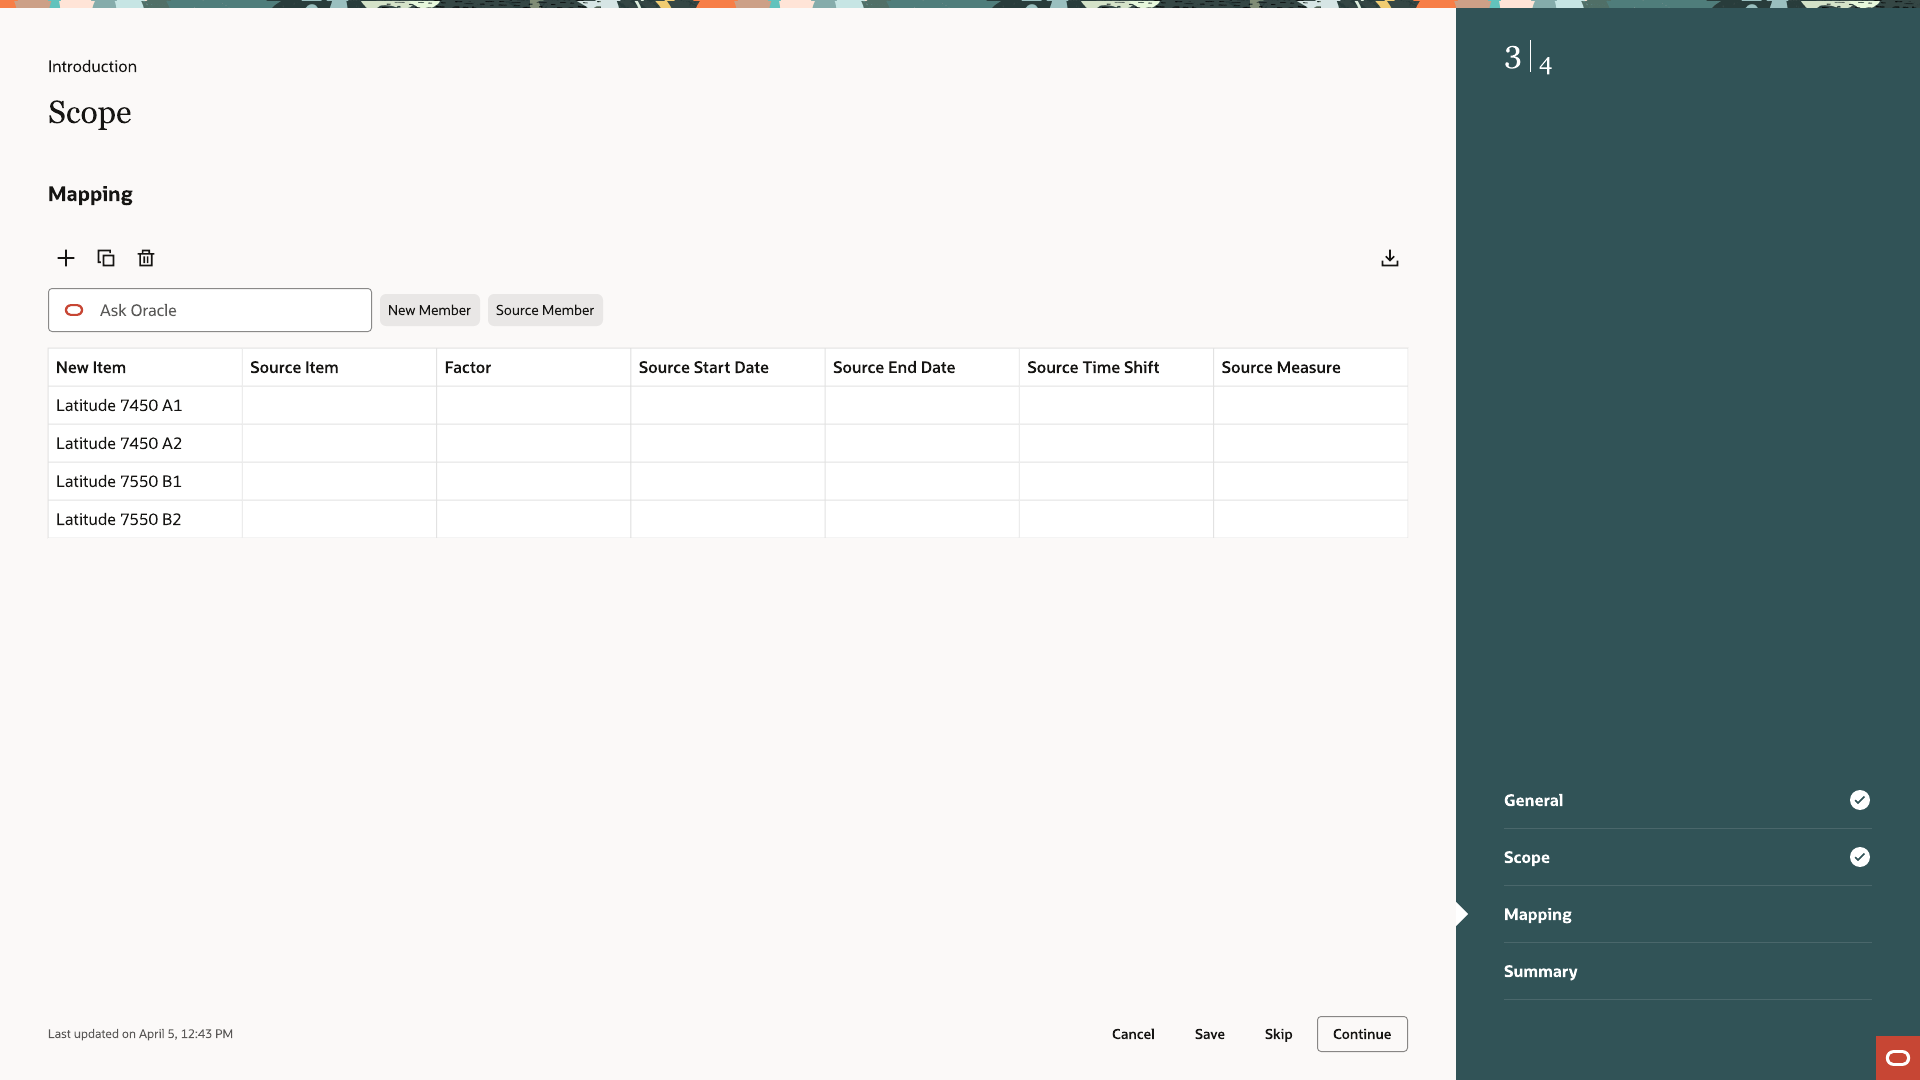
Each new item is paired with the item it's replacing, and given a factor — the percentage of that item's demand to carry over. 100 is a straight replacement. A planner can set it higher if they expect the new item to sell more, or lower if they expect less.
Step 5
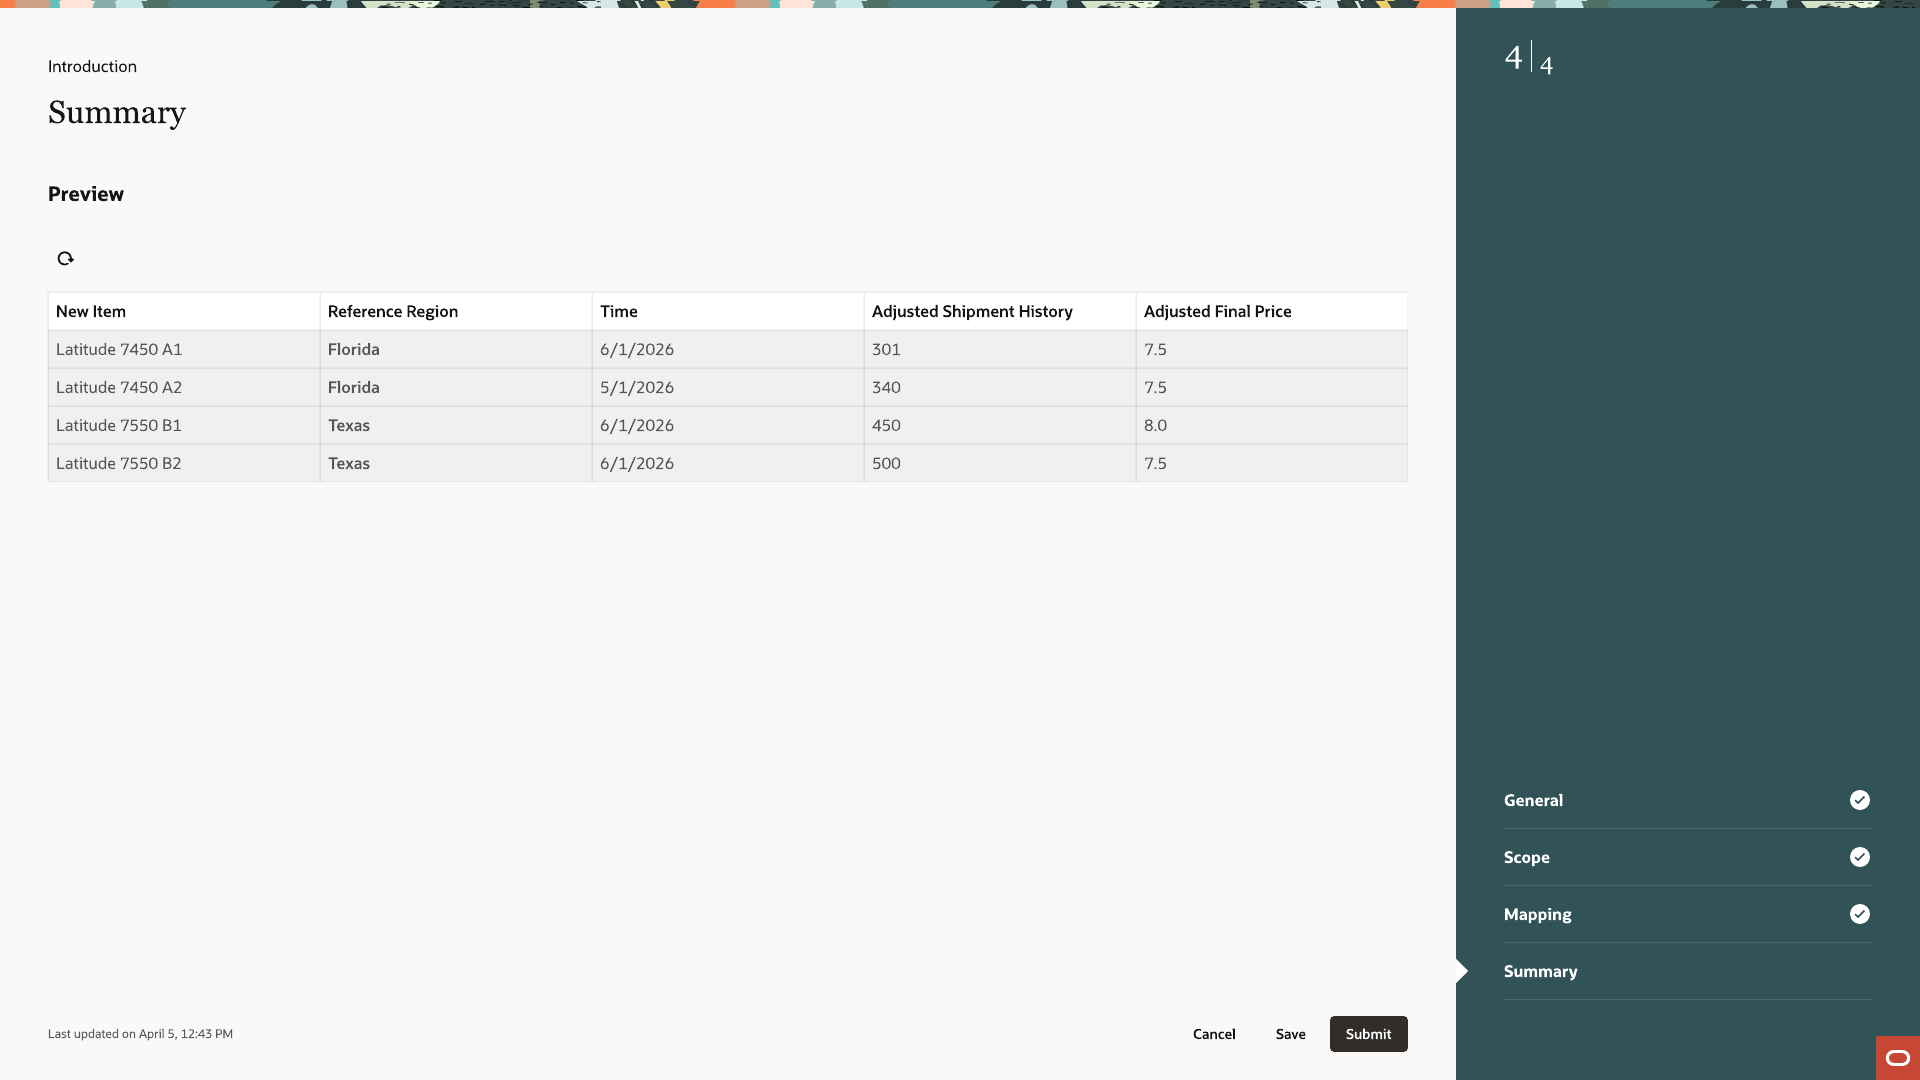
Summary
A preview of the actual numbers the introduction will produce, before it's submitted.