Rohit Mehta ← All work

New Introductions

Map demand from existing items onto new ones so new items start with a forecast.

Case studyOracle

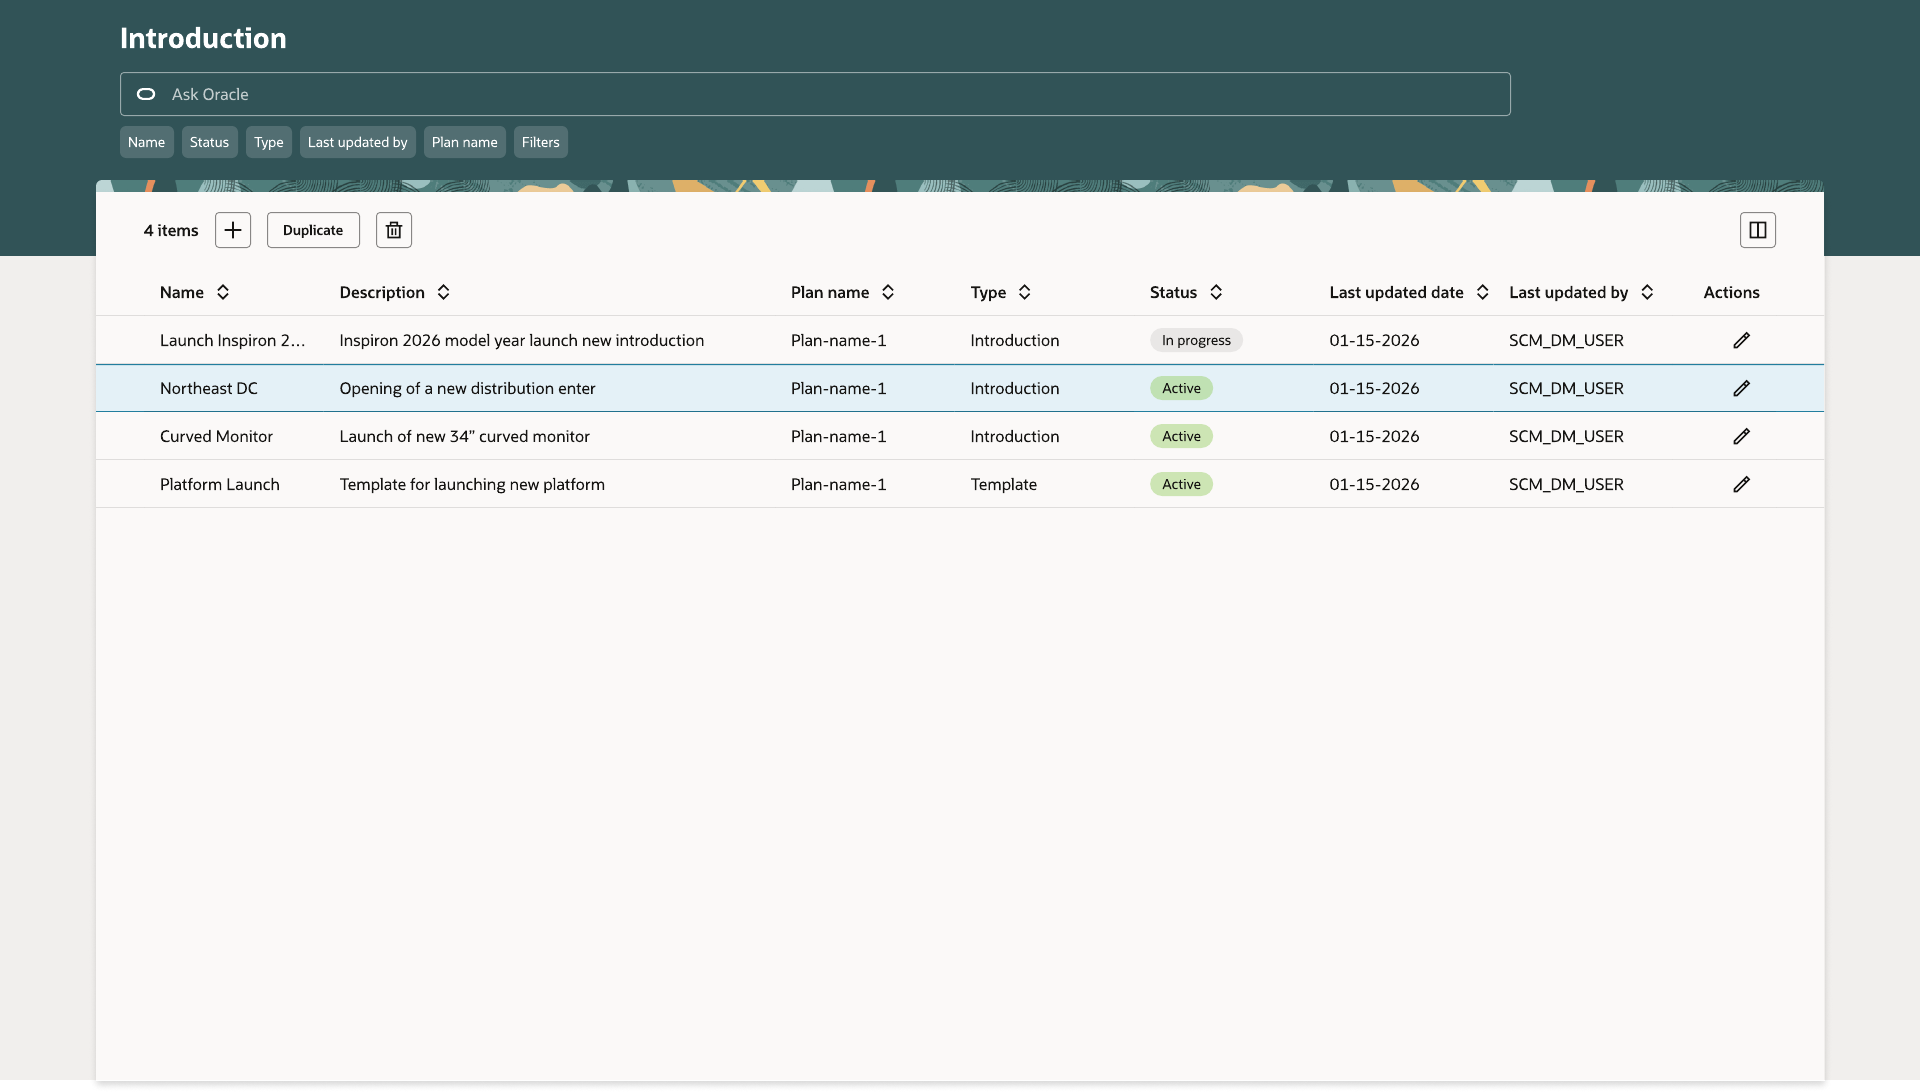
Introduction list showing name, description, plan name, type, status, and last updated date
RolePrincipal Product Designer
SkillsEnterprise UX (SCM), Systems Design, Design Systems (Redwood), Prototyping

The problem

New products, distribution centers, and customers have no sales history to forecast from.

A demand plan forecasts from historical data. Something new has none, so there is nothing for the system to calculate. Before this feature, a demand planner had no structured way to set up that forecast, and the work happened outside the system.
The solution

A guided process where a planner picks what is being introduced, what it replaces, which data to copy, and how much of the old demand carries over, then reviews the result before submitting.

Complexity

Four things shaped the design.

  1. Replacements come in four patterns: one to one, one to many, many to one, and many to many.
  2. Each new item takes a share of its source's demand, set as a factor. The factor can be above 100 if the planner expects the new item to sell more, or below 100 if they expect less.
  3. There is no fixed total the factors must add up to, so the design shows the resulting numbers instead of blocking input.
  4. The same flow has to work for products, distribution centers, and customers.

Final design

Five steps: General, Scope, Measures, Mapping, and Summary.

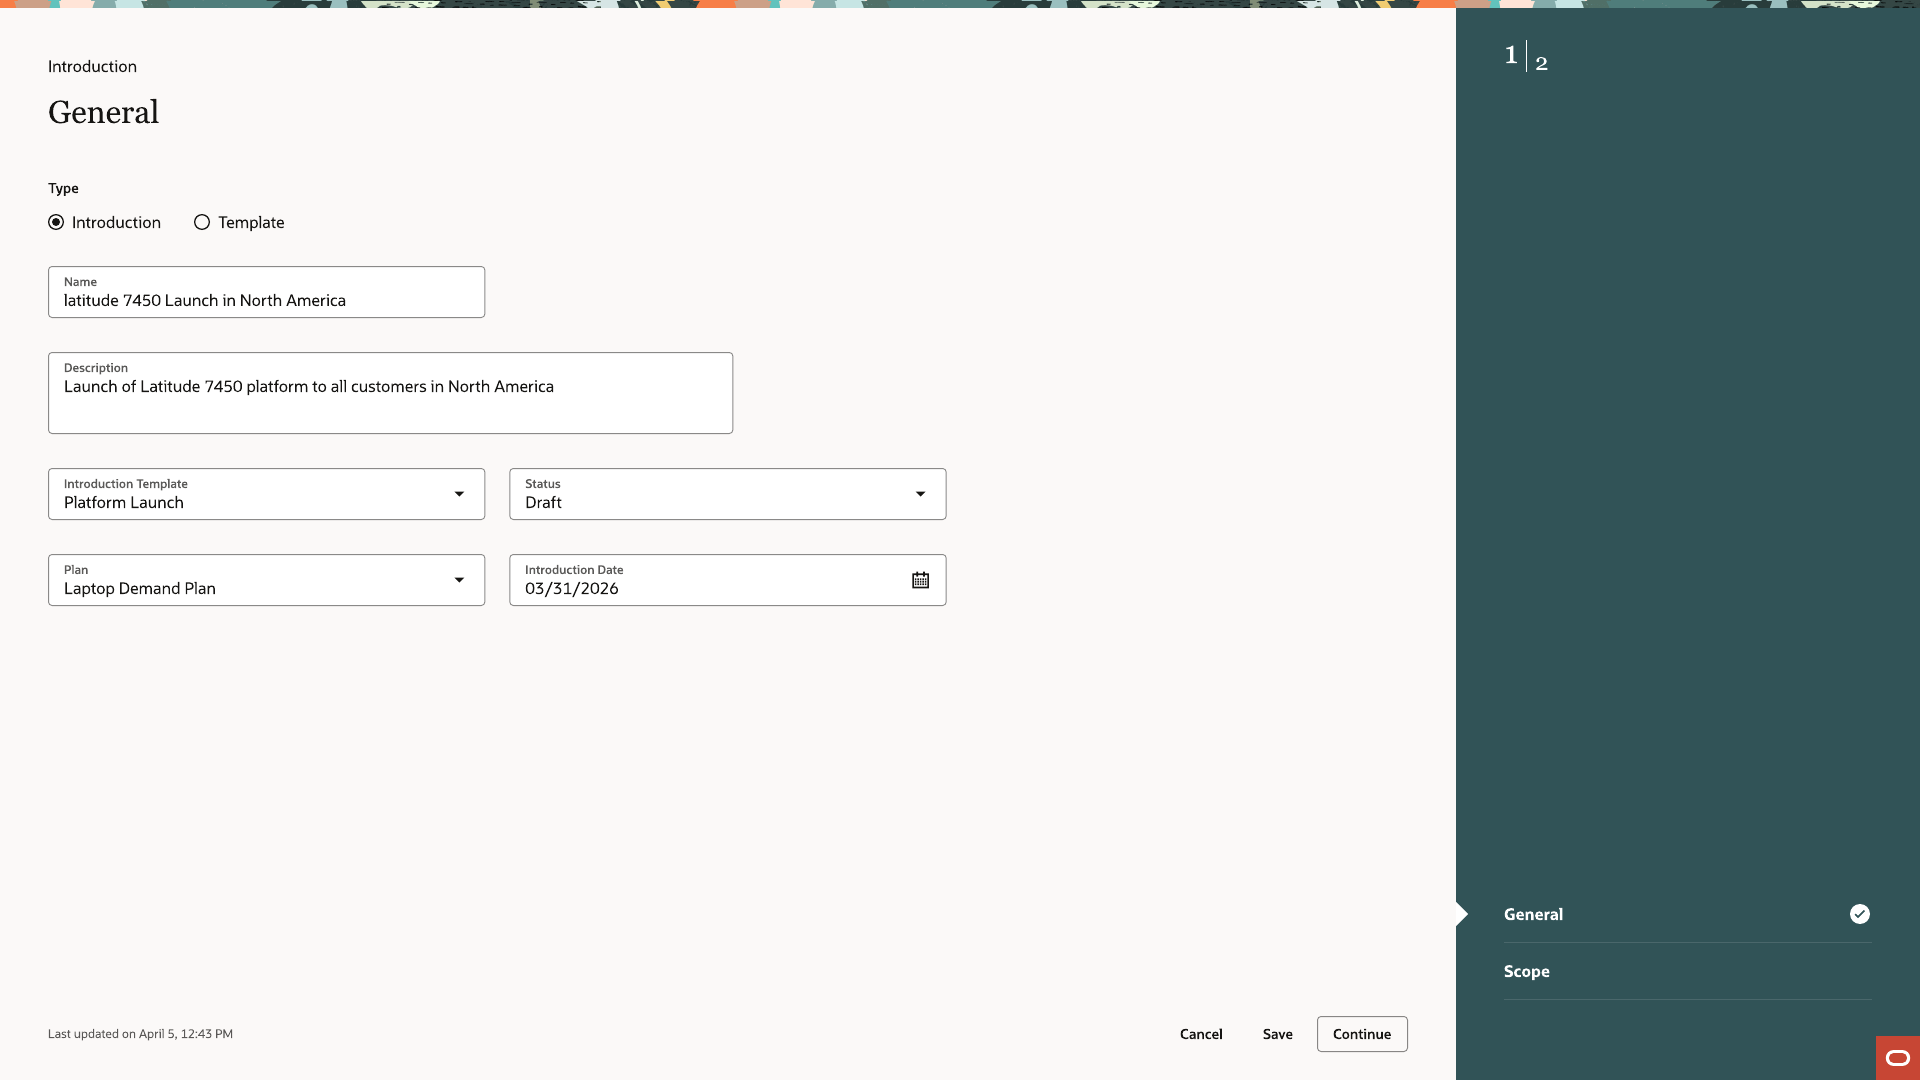
General step with Introduction/Template type selector, Name, Description, Introduction Template dropdown, Status, Plan, and Introduction Date fields
01General. Name, plan, status, and the date the introduction takes effect. A planner can also save it as a reusable template.
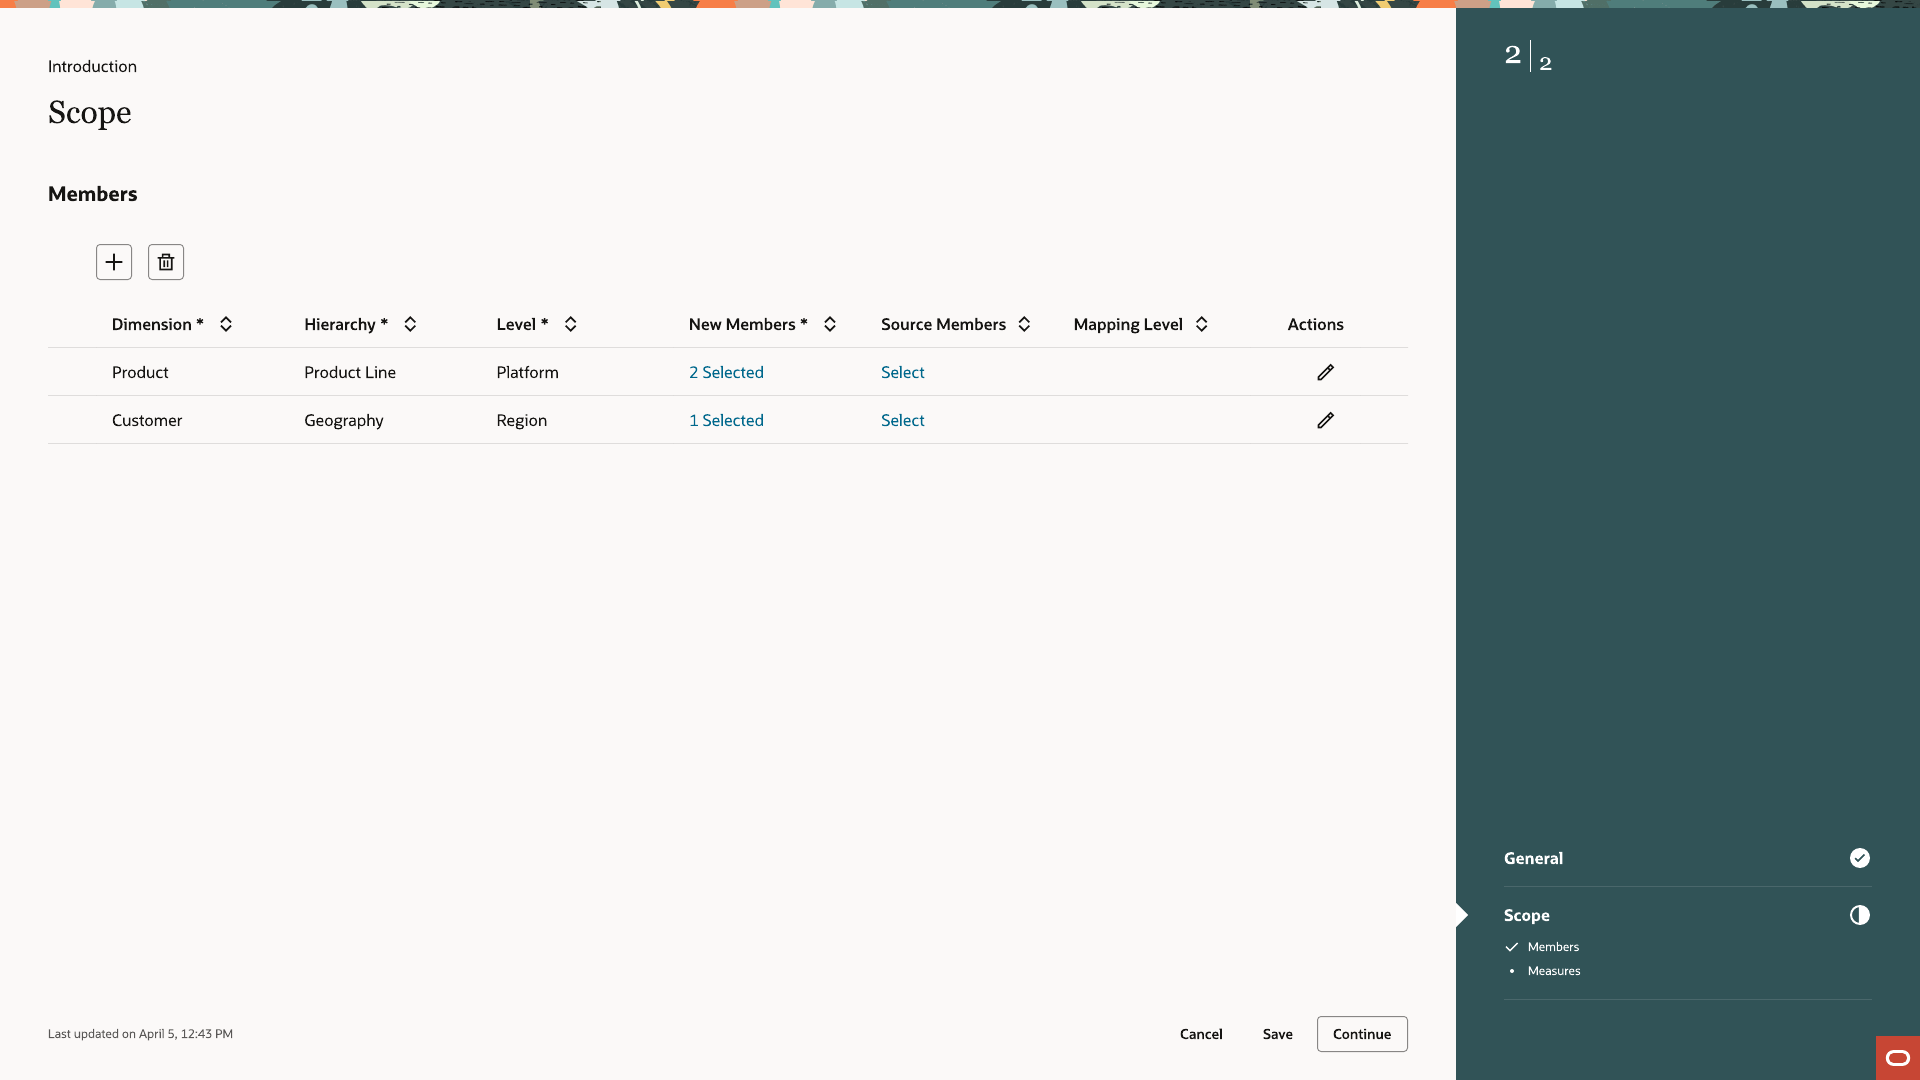
Scope step with a Members table showing Dimension, Hierarchy, Level, New Members, Source Members, and Mapping Level columns
02Scope. Choose the dimension, the new members, and the source members they replace.
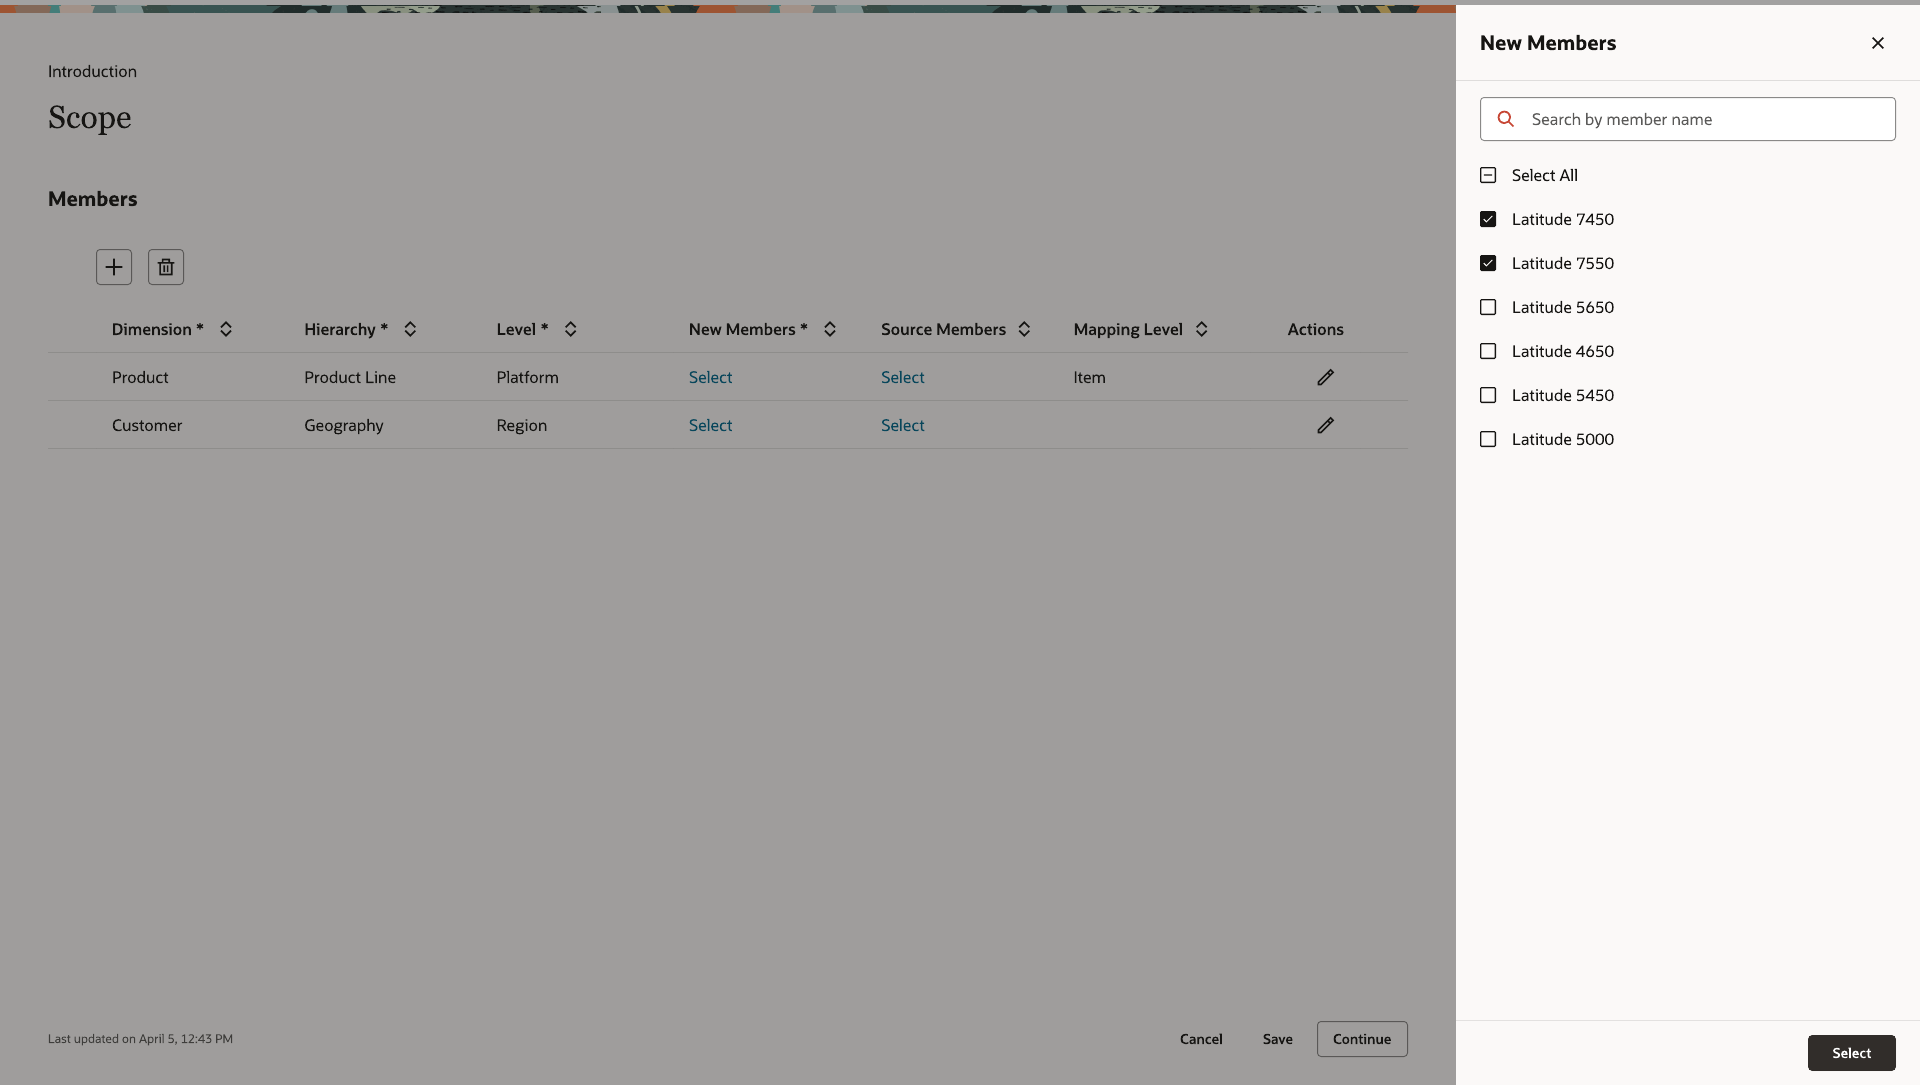
New Members panel with a searchable multi-select list of product members
03New members are picked from a searchable multi-select list.
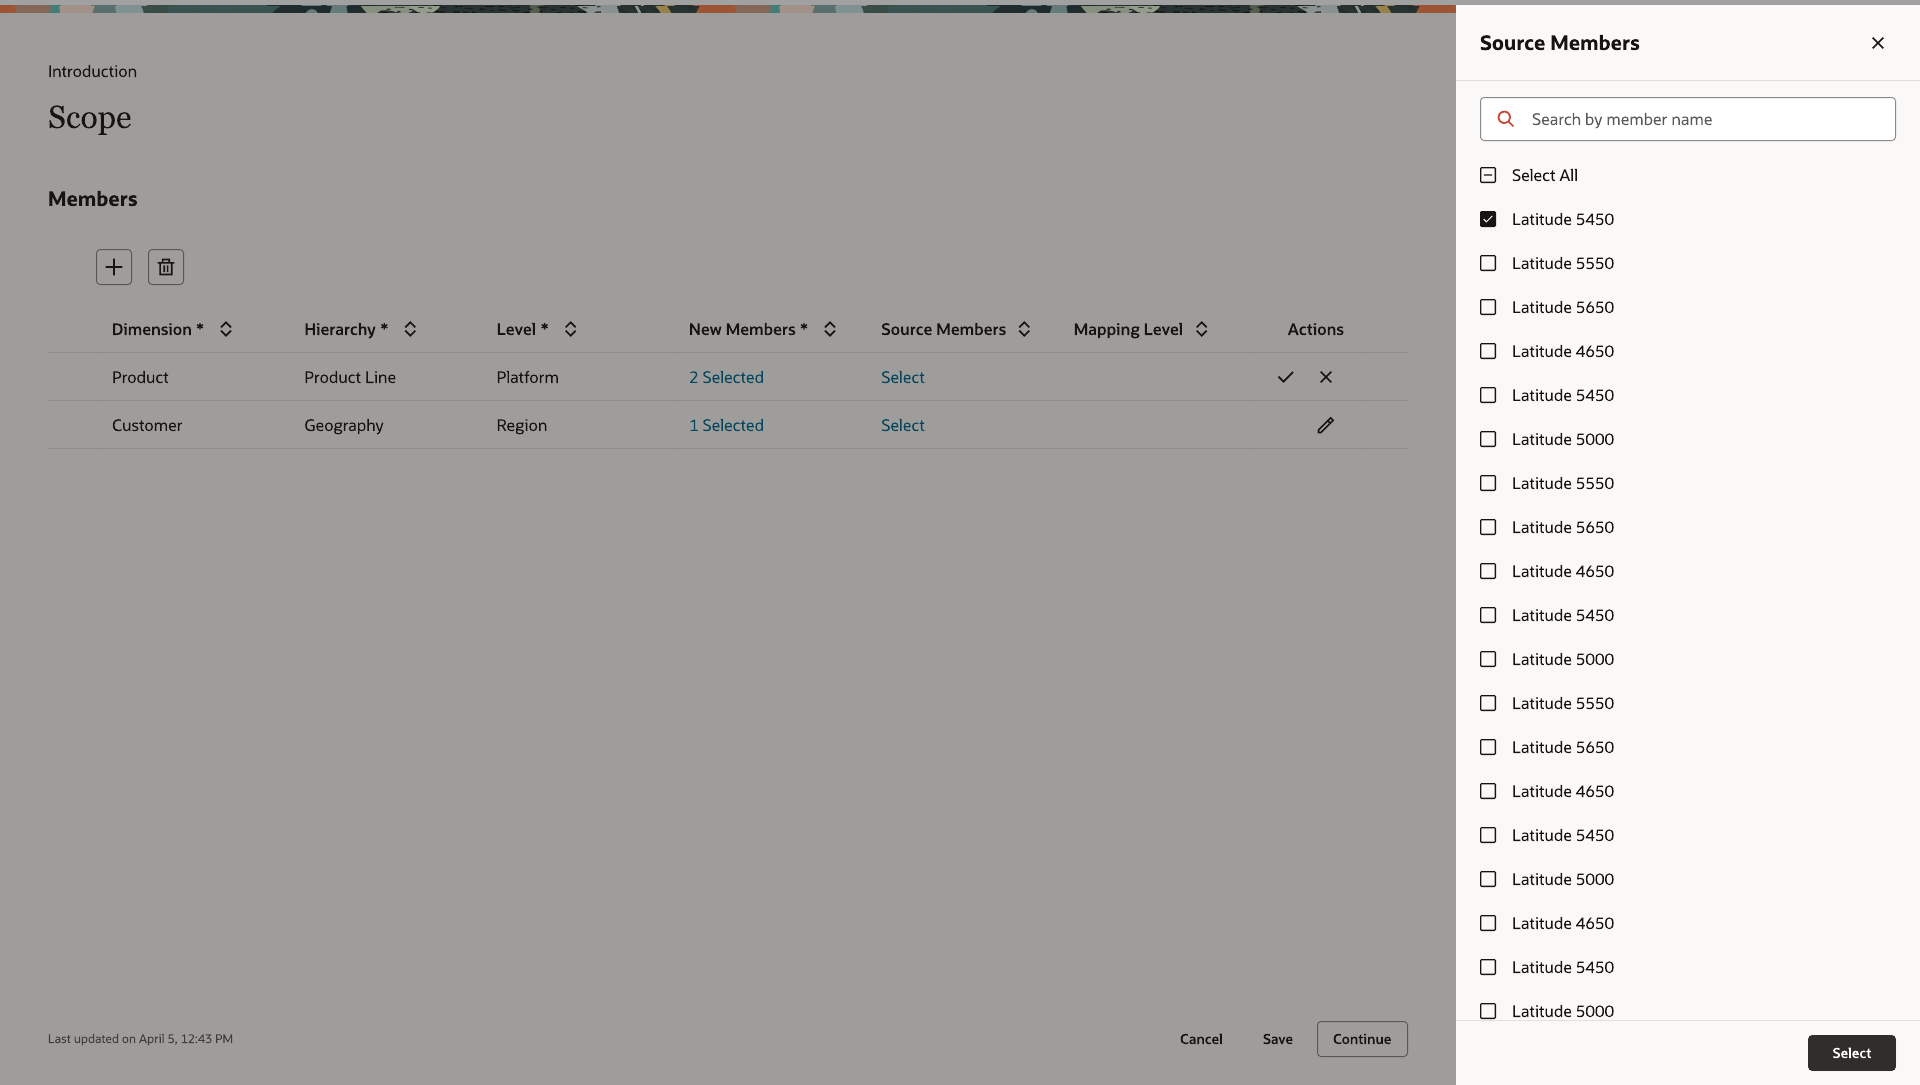
Source Members panel with a searchable multi-select list of product members
04Source members use the same picker.
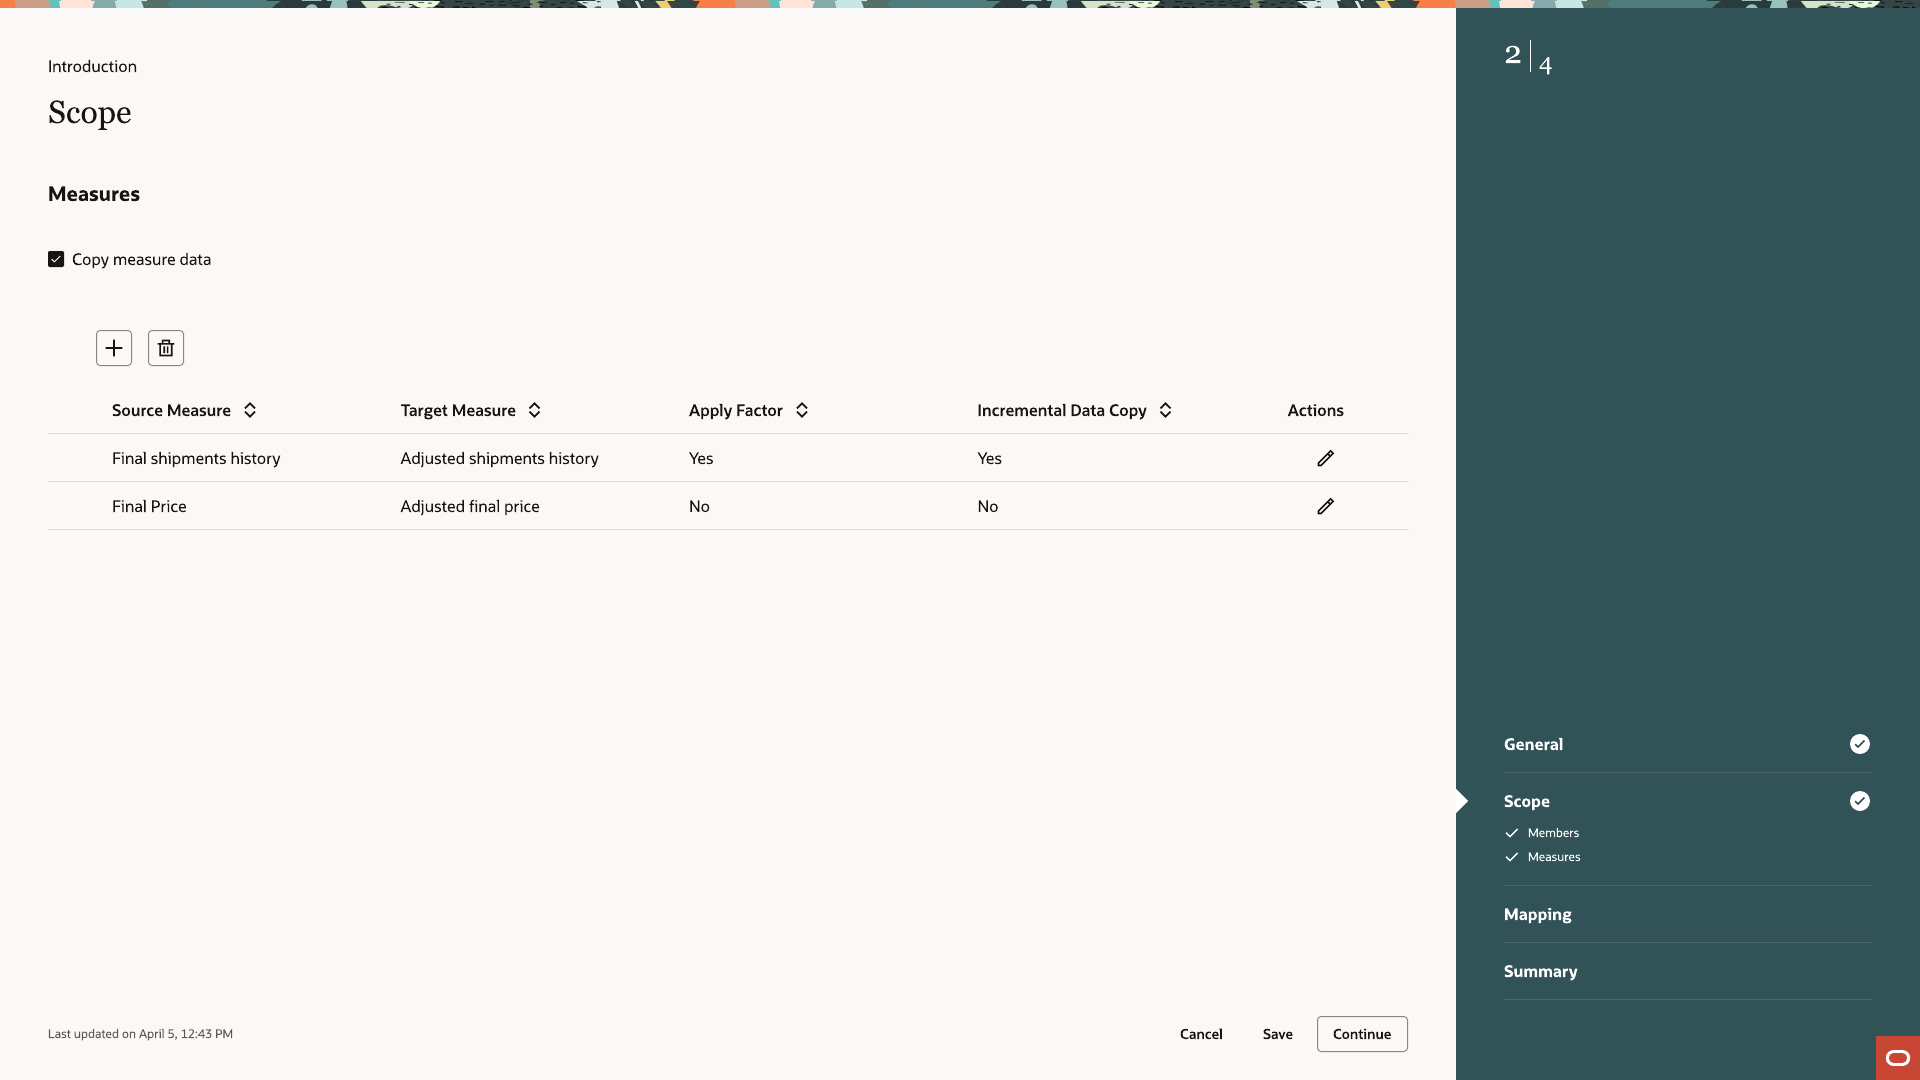
Measures step showing Source Measure, Target Measure, Apply Factor, and Incremental Data Copy columns
05Measures. Each row sets which source measure copies into which target measure, whether the factor applies, and whether the copy repeats at every plan run.
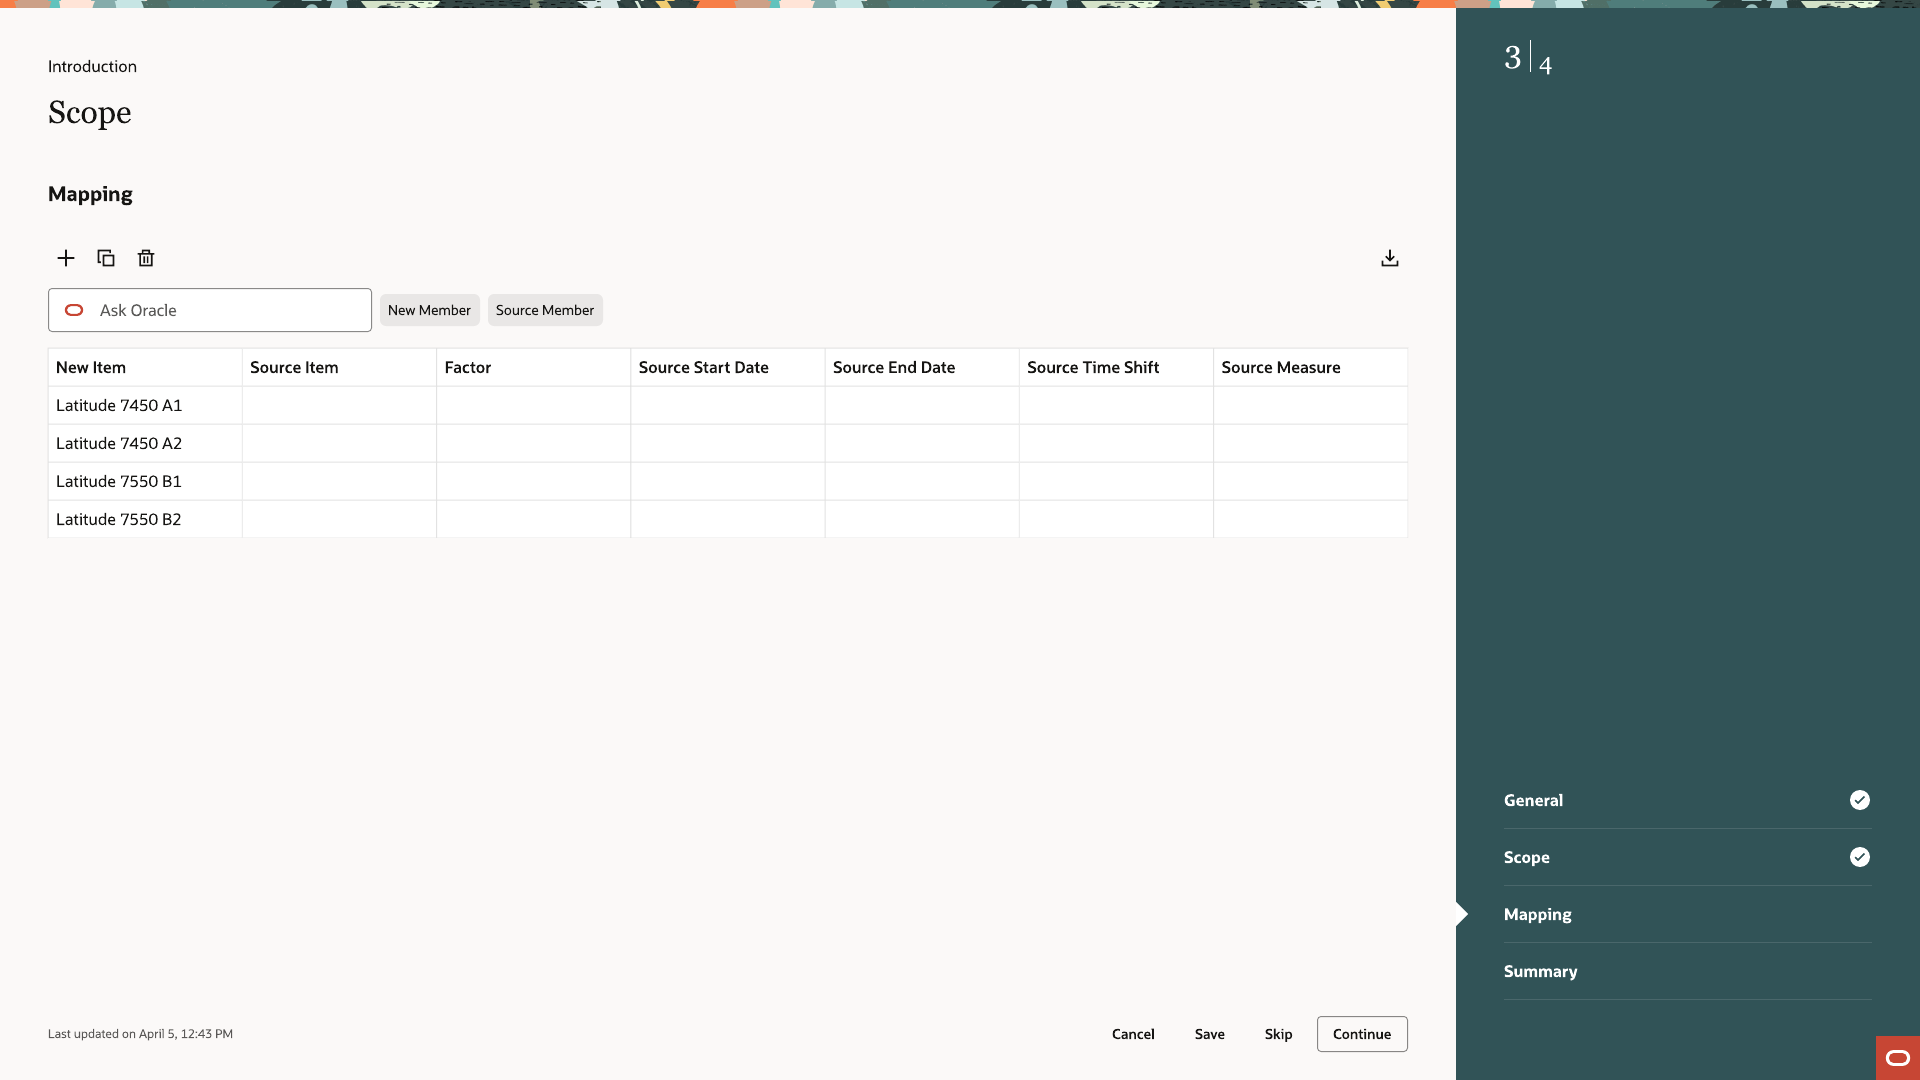
Mapping table listing four new items with empty Source Item and Factor columns
06Mapping starts with every new item listed and no source assigned.
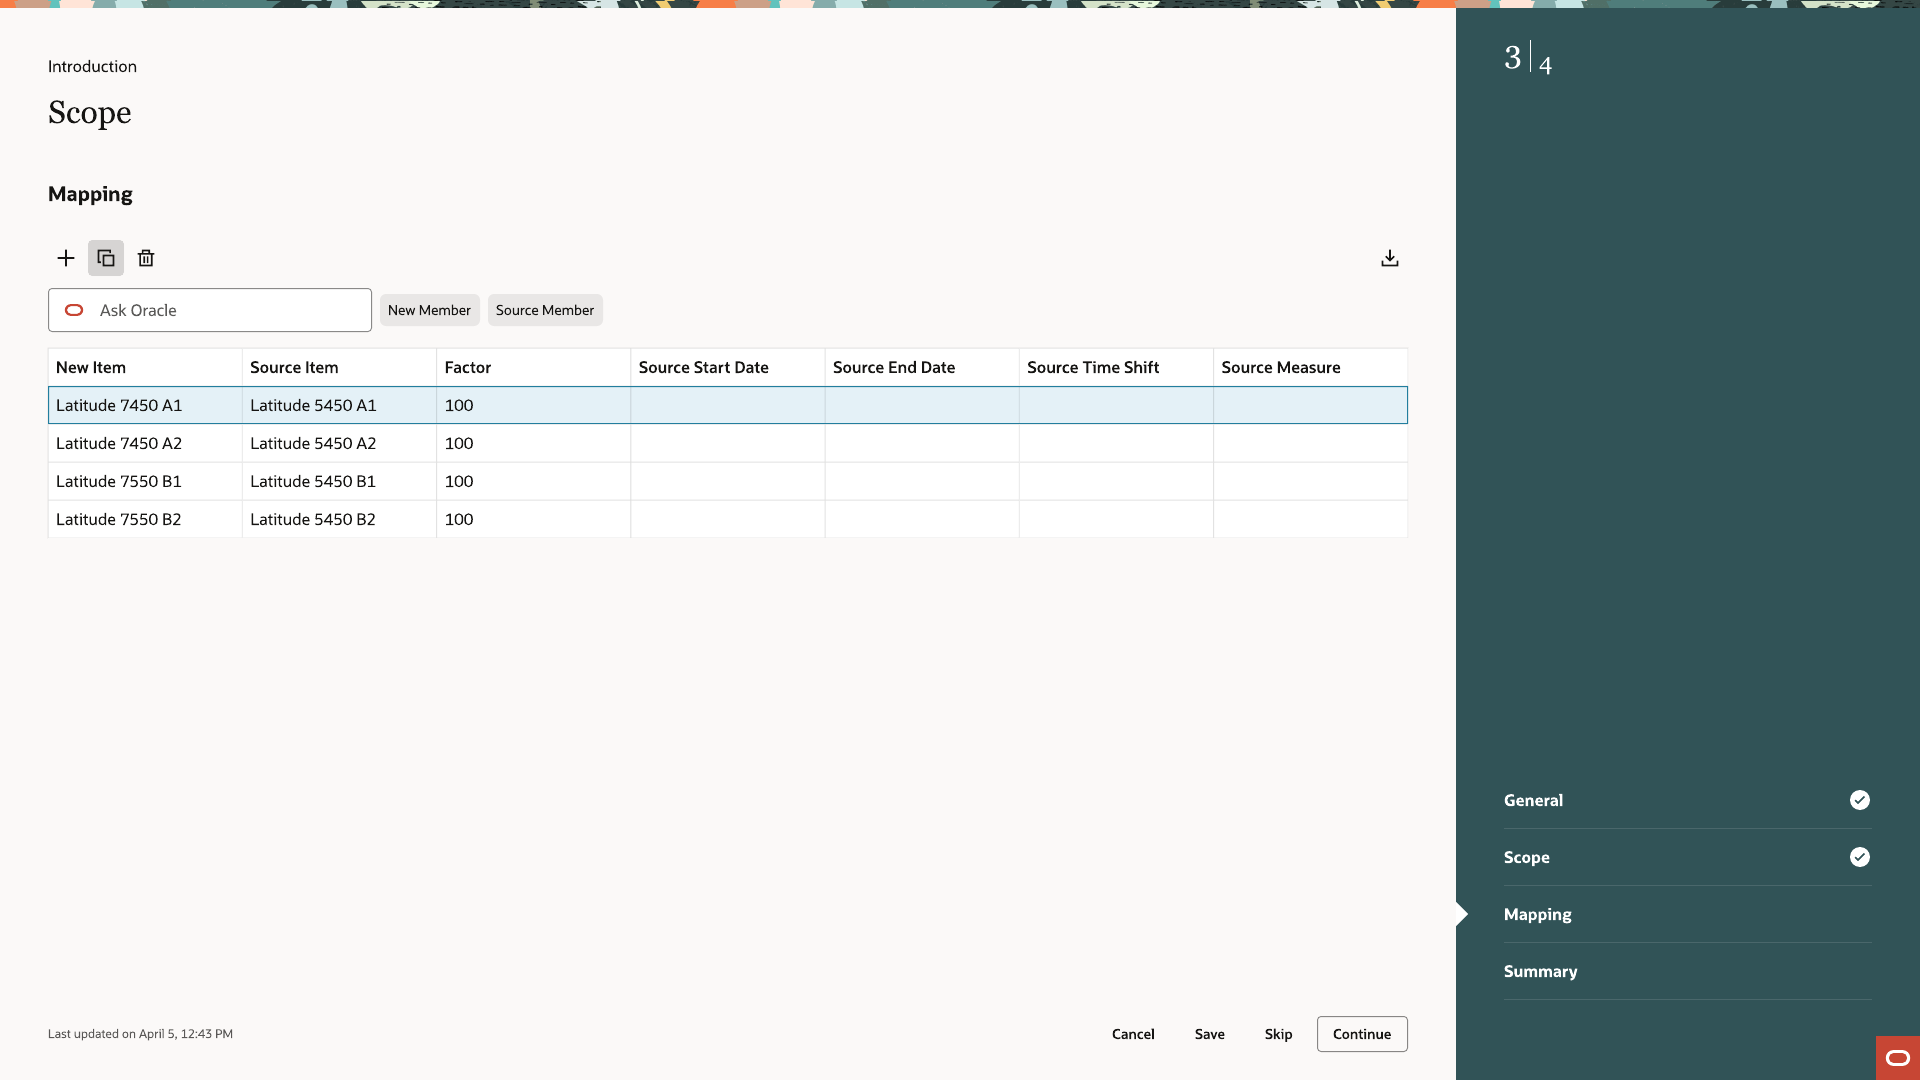
Mapping table with four rows paired, each with a Factor of 100
07Each new item is paired with a source item and given a factor. A factor of 100 copies the source demand as it is. Start date, end date, and time shift columns limit which part of the source history is used.
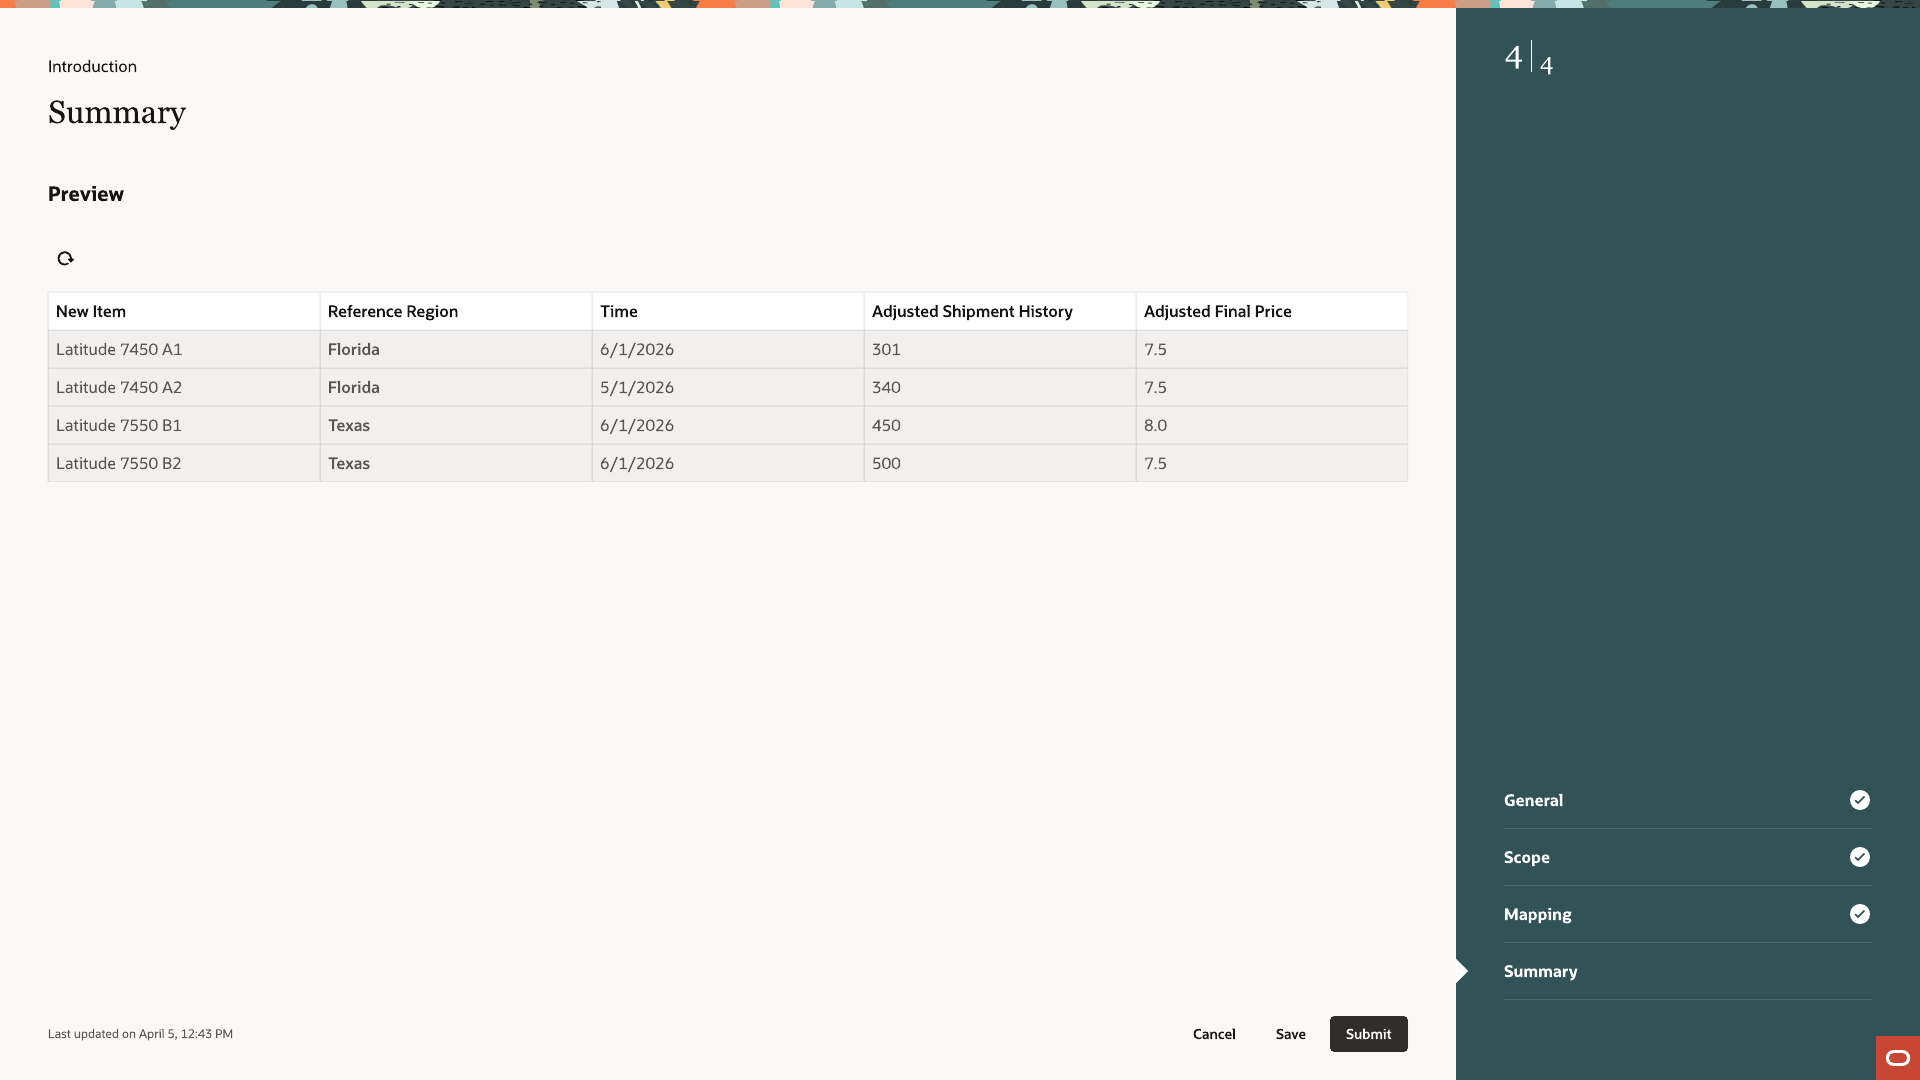
Summary preview table showing new item, reference region, time, adjusted shipment history, and adjusted final price
08Summary. A preview of the adjusted shipment history and price the introduction will write into the plan.

Key takeaways

Don't validate a number that has no right answer.

The factor is the planner's judgment. Showing the result in Mapping and Summary lets them check their own work.

Keep the scope screen generic.

Dimension, hierarchy, level, and members work the same for products, distribution centers, and customers, so a new dimension does not need a new screen.

Preview before submitting.

The Summary step shows the numbers the plan will use. It is the last chance to catch a bad factor.

Outcomes

One flow covers all four replacement patterns and works for products, distribution centers, and customers. Introductions can be saved as templates and reused for repeat launches.